
Monitoring purposes SPX: short SPX on 4/29/16 at 2065.30
Monitoring purposes GOLD: Long GDX on 4/14/16 at 21.60
Long Term Trend monitor purposes: Short SPX on 1/13/16 at 1890.28
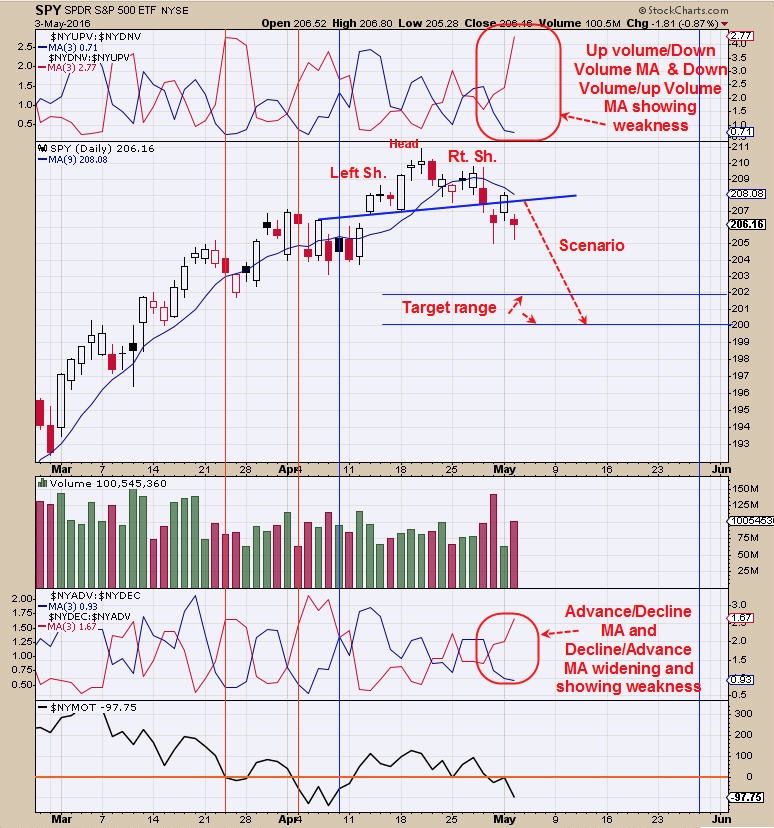
The pattern that appears to be forming on the SPY is a Head and Shoulders top where the April 20 high was the Head. Last Friday the SPY broke through the Neckline with a “Sign of Strength” and implies a valid break of the Neckline. Yesterday’s rally back to the Neckline came on about half the volume and a bearish sign and suggests the Neckline region had resistance and proved to be correct. Today’s fall came in increased volume showing the trend has turned down short term. This potential Head and Shoulders top has a measured target near 202 area. The top window is the Up volume/Down Volume with 3 period moving average and Down volume/ up Volume with a 3 period moving average and this indicator remains on a bearish crossover. The bottom window is the McClellan Oscillator which closed below “0” and remains bearish. Next window up is the Advance/Decline with 3 period moving average and Declining/Advancing with 3 period moving average and it to remains on a bearish crossover. The market internals are showing weakness for short term. Possible short term downside targets are the 202 to 200 range. The next potential signs for a low in the market should show panic in the Trin (preferable above 2.00) and ticks (preferable below -300) the same day. Today the TRIN closed at 1.95 which is near panic and ticks closed at -51 and not panic there. Decline appears not done.
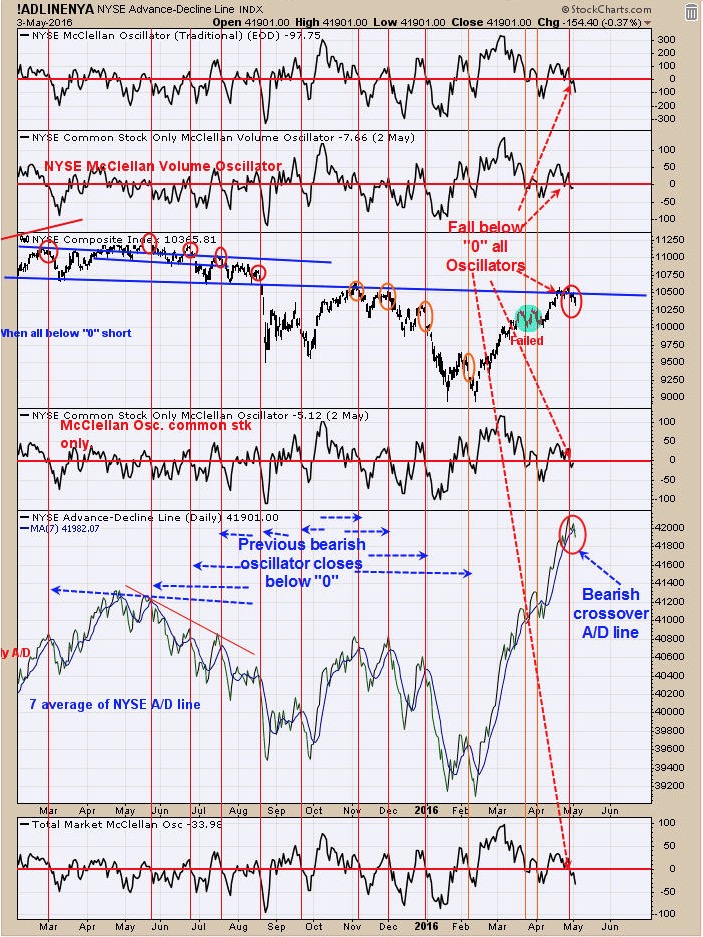
The red vertical lines on chart above show when all the Oscillators fall below the “0” line which in turn produce a sell signal. The failures where the late March and early April signals. The top window is the McClellan Oscillator which closed below “0” on Friday. Next window down is the Common stocks only McClellan Volume Oscillator which fell through the “0” line also on Friday. Bottom window is the Total Market McClellan Oscillator which closed below “0” on Friday and the middle window is the Common stocks only McClellan Oscillator which also fell below “0” on Friday. Today the 7 period moving average of the Advance/Decline produced a bearish crossover and added to bearish short term picture. Short SPX on 4/29/16 at 2065.30.
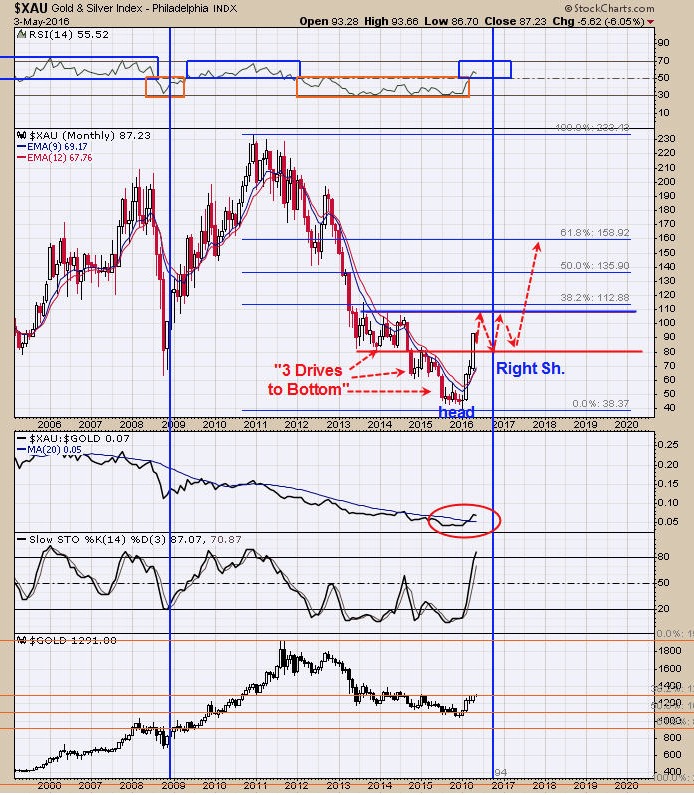
The Gold Commercials came in at -240,108contracts as of 4/29/16; previous week reading was minus 240,121 contracts. Though gold may stubble short term the gold stocks may stay strong. The chart above is the monthly XAU going back to 2005. The pattern that appeared to form going into the December 2015 low was a “Three Drives to Bottom”. This pattern has a target up to where the pattern began and in this case would have a target near 110 on the XAU. The 110 range produced a sideways consolidation that last about one year and will be a stiff resistance. XAU may find resistance near 110 and start a sideways consolidation that could take one year to complete before heading higher again. We don’t believe the rally form the December low is finished and may push higher into the 110 range before a larger consolidation take over. Target on XAU over the several weeks is the 110 range. Long GDX at 21.60 on 4/14/16; Stop at 22.00 on 5/2/16.
Tim Ord,
Editor
For examples in how "Ord-Volume" works, visit www.ord-oracle.com. New Book release "The Secret Science of Price and Volume" by Timothy Ord, buy on www.Amazon.com