
Relative Strength Index is a momentum indicator measuring and simplifying price movement. It identifies when stock is overbought or oversold. These gives entry and exit signals; but equally valuable, RSI serves as both a confirmation tool and as an early reversal signal that is confirmed by other technical signs. For options traders, this is valuable as a form of confirmation. This oscillator calculates the ratio between upward-moving and downward-moving sessions over the past 14 days, and creates an index between zero and 100. When the index moves above 70, the stock is overbought. When it moves below 30, it is oversold.
This is a simplification. Momentum indicators like RSI are only pieces of the larger puzzle, and need confirmation. RSI measures the speed of change but does not offer a guarantee that reversal is impending. RSI works best when used to confirm what you see in traditional price patterns, candlestick formations, or in combinations of both.
RSI, especially by itself, can be misleading. This is especially true when a very strong trend is underway. An overbought condition in a strong uptrend (or oversold in a strong downtrend) does not always signal reversal. For this reason, RSI cannot be relied upon by itself, but needs to be put to work with a range of other price and momentum measurements.
Consider two examples of how RSI interacts with price. The chart of Apple provides clear reversal signals through RSI, with equally strong confirmation. The first overbought signal is minimal and anticipates bearish reversal. However, the signal is not confirmed until two weeks later, when price moves below the t-line (8-day EMA of price). This shift points to bearish reversal, confirmed when price closes below the t-line for several consecutive sessions.
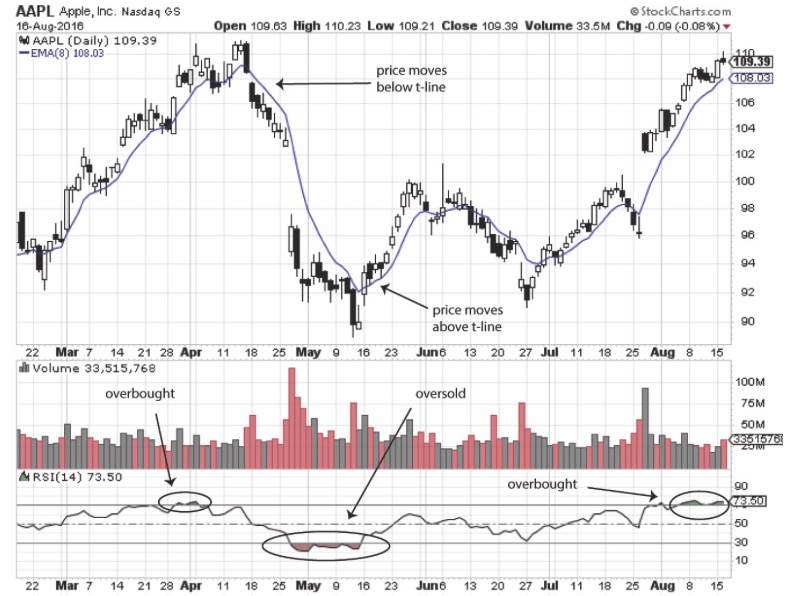
Next came an oversold signal, convincing because it lasted over two weeks. Once again, however, the bullish reaction did not occur until price moved above the t-line and continued to close in this bullish territory. A final overbought signal occurred at the end of the first week of August and continued through August 16. However, there are no confirming signals indicating reversal. In this case, one of two possibilities indicate how to interpret the RSI change. First, because it reflects a moving average of the past 14 sessions, this move into overbought might be a false signal that eventually will return back below the 70 index level. Second, this could foreshadow a reversal if other signals develop, such as a bearish candlestick formation, movement of price to close below the t-line, or a volume spike. Anyone holding positions in this situation need to closely monitor the stock’s performance looking for reversal signals or a change in RSI.
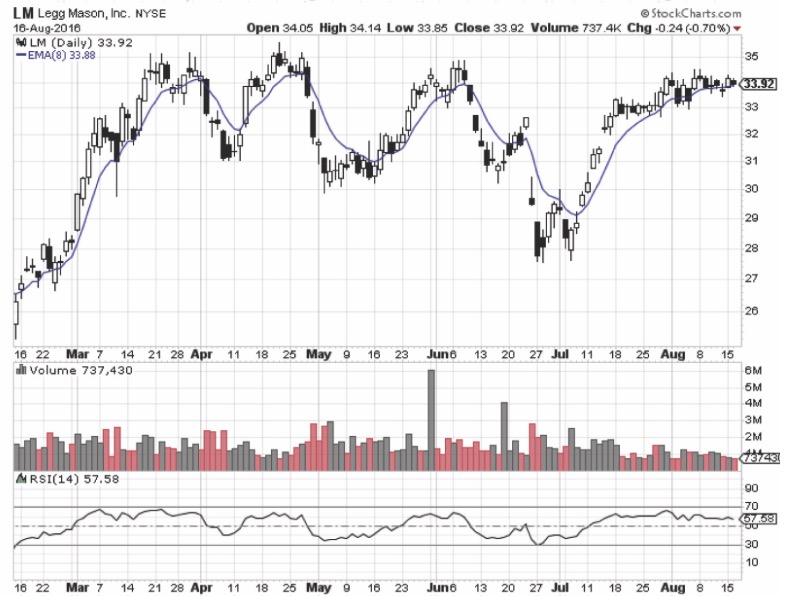
Another example reveals a difference attribute of RSI. When a stock seems moderately volatile but RSI does not move above the 70 or below the 30 index value, the lack of signal reveals the likelihood that the current price range is not excessive. For example, the chart of Legg Mason (LM) reveals a see-saw tendency in price, moving in either direction four to seven points in two to four-week trends. Even so, RSUI never moves out of the middle range.
 Some traders want to see overbought and oversold signals, so they adjust RSI to a shorter average. For example, if the duration of the calculation is reduced to 6 sessions, the LM chart’s appearance changes dramatically.
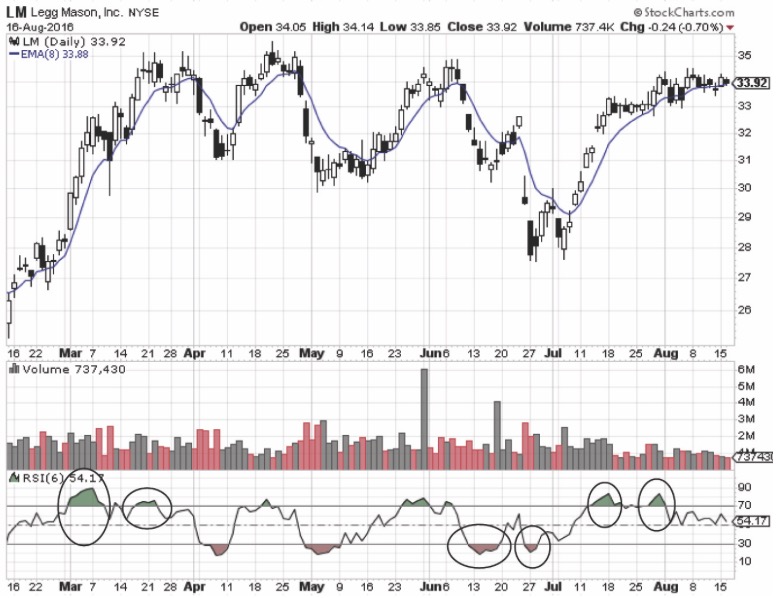 Now LM reports frequent movement above 70 and below 30. But is this better?
No. In fact, there are at least six instances highlighted on the chart in which RSI gives off a false signal. Traders acting on these signals will make ill-timed trades. The default of 14 periods yields fewer signals, but is better at identifying accurately when the price of the stock truly is overbought or oversold.
Indicators like RSI and other oscillators can be difficult to interpret, notably if the default period is adjusted. Because an RSI movement may be the result of too much movement in the trend, or merely a reflection of fast price trending, confirmation is essential. In the Apply example, the t-line provided excellent confirmation of both overbought and oversold; and in the most recent move of RSI into overbought, traders need to monitor the situation to determine whether this is a false signal or the first forecast of a coming retracement of bearish reversal.
Michael Thomsett blogs at TheStreet.com, Seeking Alpha, and several other sites. He has been trading options for 35 years.