
Traders are on an unending quest for reliable, easily visible reversal signals. These do not always materialize. However, in one case, that of Netflix (NFLX), several island clusters provide exceptional reversal signaling. This is shown on the chart.
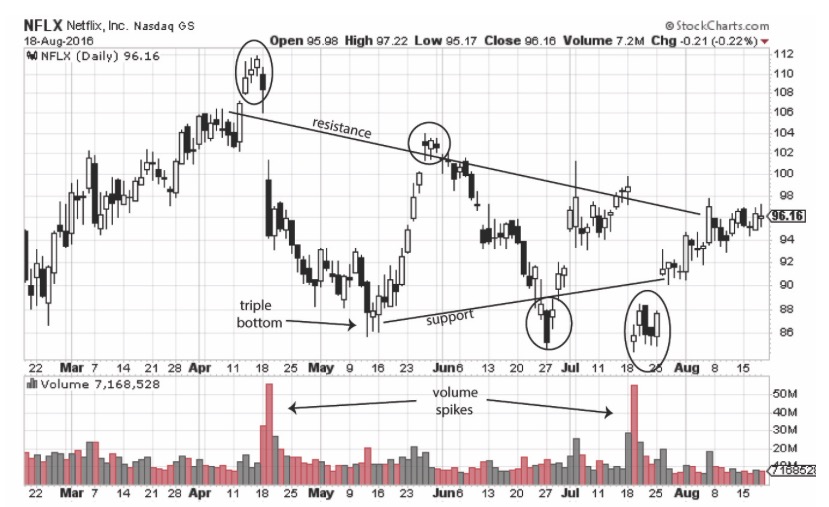
The specific cluster occurrences are marked with circles on this chart. The island cluster, by definition, contains a limited number of sessions trading either above resistance or below support; and is separated by a price gap on both sides, resulting in a return to the established trading range. As a failed breakout, the island cluster is a strong confirming signal for the current trading range. It is even stronger as a clear reversal.
On this chart, the first cluster appeared above resistance and was confirmed by a volume spike. The expected price decline ended with the triple bottom testing support, and a new bullish move. The second island cluster once again occurred above the declining support but was supported only by a return of price back into range with a decline during the month of June.
At this point, the occurrence of island clusters switched to tests of support. The first was seen toward the end of June and was followed by a jump back into range. The final cluster again tested support and was confirmed by a volume spike.
Overall, the period from early April to early August also formed a symmetrical triangle, also called a coil. This normally is described as a continuation pattern, but it may also signal reversal. The problem with this triangle is that the direction is not strongly indicated. However, as the triangle forms, the existence of other signals such as island clusters provides strong timing signals for short-term trading. In this case, the combination of clusters with one triple bottom and two volume spikes is excellent for identifying entry and exit points for short-term trades.
A next step in a case like this depends on whether or not the seesaw form of volatility will continue into the future. If additional island clusters appear, the likelihood of reversal is exceptionally strong, especially when confirmed independently. Look for candlestick reversal or continuation, volume spikes, momentum shifts to overbought or oversold, and Western technical signals like the triple bottom.
The look back at historical price patterns is an easy task. Looking ahead presents additional challenges. Does the collective signaling on this chart imply bearish or bullish moves to follow? Several possible interpretations may be used to make this determination. For example, the triple bottom and final island cluster could be labeled as shoulders and the second-to-last cluster as the head in an inverse head and shoulders, a bullish signal. There are two flaws in this assumption. First, the second shoulder actually trades below the head, negating the signal. Second, the head itself represents the marketwide decline resulting from announcement of the Brexit vote and, because it represents a short-term spike in market trends, it should be discounted as part of a longer-term signaling pattern.
The price appears to be moving out of the triangle toward the upside. However, before identifying it as bullish reversal or bearish confirmation, more signals are required. As of the end of the chart, no such signals have emerged of a convincing nature. Two bearish harami formations showed up starting on August 1 and then again on August 5. However, these did not result in a bearish turn in price. The harami is a relatively weak signal, leading to reversal only about 50% of the time.
This exercise does not predict price movement for the future. However, it does reveal how the island cluster works in a larger context of reversal and confirmation in a very interesting pattern: falling resistance and rising support forming a symmetrical triangle, with numerous failed breakouts creating strong reversals in the form of island clusters. As these observations are applied to future price behavior, similar volatile movement in price outside of the trading range may signal advantageous timing for swing trades.
Michael Thomsett blogs at TheStreet.com, Seeking Alpha, and several other sites. He has been trading options for 35 years and has published books with Palgrave Macmillan, Wiley, FT Press and Amacom, among others. His latest book is tinyurl.com/z44kzlu