
Tootsie Roll (TR) trading over the past year in a 10-point price increase. But it started out the 12 months range-bound between $29 and $32 per share.
The dilemma for traders in this situation is determining when price will break out. In fact, by overlaying Bollinger Bands (BB), plenty of signals appear. These are highlighted on the TR chart.
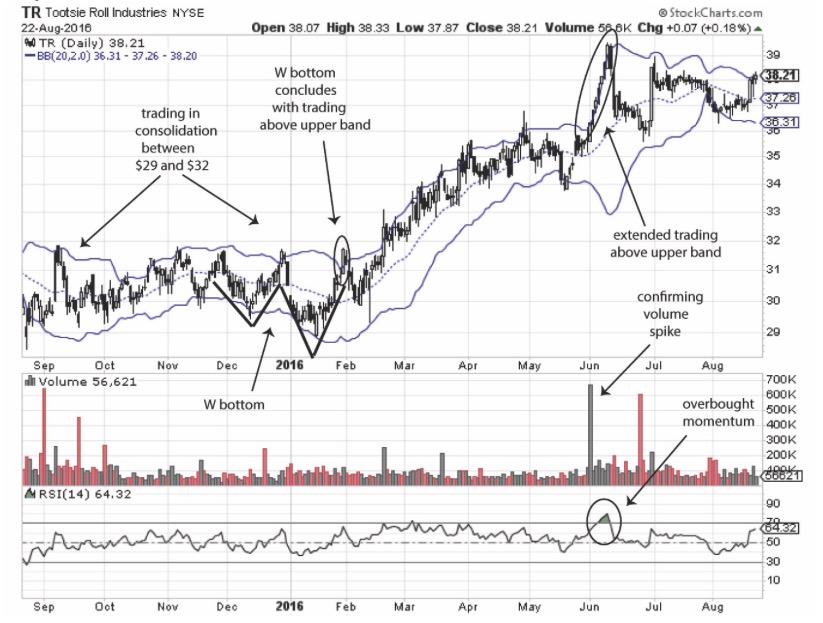
The first highlight is a prominent W bottom from late November through mid-February. This is a summary of the price movement in the BB range with specific attributes. First, it should form the letter W, as shown on the chart. Second, the last leg of the W should move above the upper band, as highlighted. When this occurs, it has the same strength as a double bottom or triple bottom. It also signals a likely bullish move to follow.
As price did break out above the resistance level of ?$32 per share, a three-month bullish trend began. It leveled out momentarily in the first half of May. Then from late May through early June, a rapid acceleration in price forecast a correction in several ways. First price closed above the upper band for several consecutive sessions, which is very unusual. The overly rapid price movement was confirmed by two additional signals, a volume spike and the move of RSI into overbought territory.
Bollinger Bands presents a desirable guide for understanding many aspects of price behavior. Beyond the W bottom (and its bearish counterpart, the M top), look for the Bollinger squeeze, a narrowing of price breadth close to either the upper or lower band. This predicts a strong move in the direction indicated. Also observe increasing or decreasing volatility. On the TR chart, volatility remained consistent between 2 and 4 points, with one exception. As the large price move occurred in late May and early June, volatility rapidly evolved to six points, about twice the breadth of average. This further confirmed the likelihood of a correction.
Because price tends to trade within the bands most of the time, this overlay sets up an exceptional “probability matrix” enabling you to track both price trend and volatility, helping to better time trades. BB also creates a dynamic form of resistance and support. The upper band presents dynamic resistance as price advances, and the lower band tracks support as price declines. This is easily observed on the TR chart.
Finally, as the chart revealed, BB provides strong signals in anticipation of a consolidation trend coming to an end. The many ways that signals are derived from the BB overlay helps, especially in swing trading. By reducing the period charted to fewer months, a clearer view of price signals is available, to add more confirmation to reversal or continuation signals.
BB is one of the most useful of technical signals. It is especially accurate in clarifying what is going on when a stock becomes more volatile than usual.
Michael Thomsett blogs at TheStreet.com, Seeking Alpha, and several other sites. He has been trading options for 35 years and has published books with Palgrave Macmillan, Wiley, FT Press and Amacom, among others.