
Finding a Triangle Hiding In The Chaos
I rarely talk about price objectives, because I have found that there are only a few reliable tools for that, and they only appear infrequently. But I recently shared an interesting price objective with my Daily Edition readers, derived from the triangle structure shown in this week’s chart.
Edwards and Magee talked about the measuring objectives given by structures such as symmetrical triangles, flags/pennants, and head and shoulders in their classic book, Technical Analysis of Stock Trends. That book is a must-read for any aspiring technical analyst.
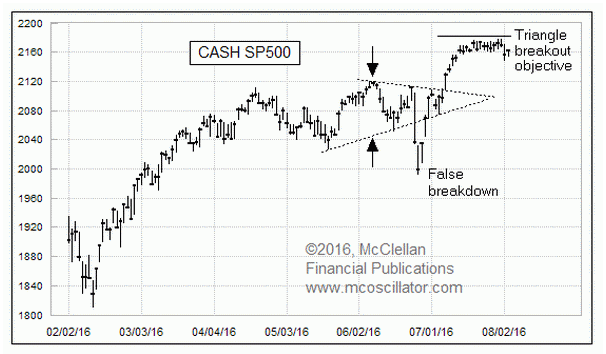
For a triangle, the measuring objective is obtained by measuring the height of the triangle as shown with the arrows in the chart above, and then adding that distance to the breakout point. When I shared that chart with my subscribers, the SP500 had just broken out and was at the 2129 level. I stated that the upside objective from the triangle was “about 2180”, and that trying to calculate it any more exactly would be expecting more precision from the market than the market usually lives up to. As it turned out, though, the intraday high on August 1, 2016 of 2178.29 is pretty darned close to 2180.
That top date also just happened to occur at the time-point of the apex of the triangle, a fun coincidence, and actually not all that unusual. The apex of a triangle can have importance in price or time, and sometimes both.
The one big conflict with this particular triangle structure is that there was a big downward break on the Brexit news. A downward break like that might seem to invalidate the triangle as a structure for giving an upside objective. But what I noted at the time of the breakout was that the Brexit surprise was quickly undone by investors, and the SP500 returned to the inside of the triangle very quickly thereafter. Furthermore, the action after the Brexit swoon saw the SP500 re-touch both the upper and lower boundary lines, as if the triangle was being rehabilitated and revalidated.
I don’t usually advocate putting a thumb over a bit of price action and ignoring it on the chart, but sometimes that is appropriate. After President Eisenhower’s heart attack in 1957, there was a quick selloff but then also just as quick of a rebound as investors learned that it was not going to be a big deal affecting stock prices. The same phenomenon also occurred after President Kennedy’s assassination in 1963, an immediate drop and then a rebound back to trend. The Brexit reaction seems to be in the same category.
Tom McClellan
Editor, The McClellan Market Report