In an extended bull market with very few painful corrections, why does one down day feel so downright dreadful? The answer is “myopic loss aversion” which was proposed in the early 1990’s by Bernartzi and Thaler. To summarize, we feel the agony of losses much more than the joy of gains. Also, the more you pay attention to your portfolio, the more you will tend to fall victim to this bias. Let’s examine both of these issues for investors.
The Overwhelming Pain of Losses
I wrote recently about the Adaptive Markets Hypothesis and Professor Andrew Lo’s conjecture that the markets move based on supply and demand driven by fear and greed. I would argue that the markets are actually driven by fear and fear. That is, fear of missing out and fear of losing everything.
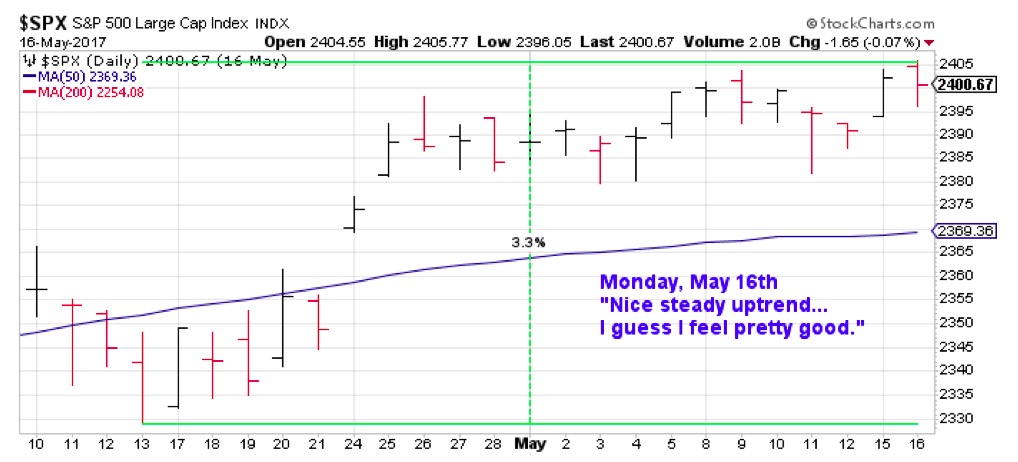
As an illustration of loss aversion, here is a chart of the S&P 500 through Monday, May 16th:
…and here is a chart of the S&P 500 through Tuesday, May 17th:
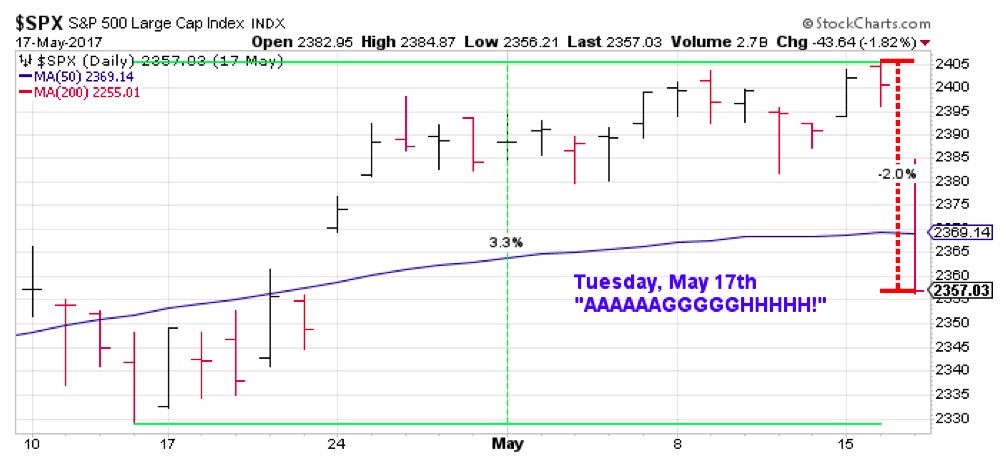
After a month of steady up days and no correction (during an extended cyclical bull market), it just takes one down day to make it seem as if the entire financial system is unraveling.
As Josh Brown mentioned on his blog, “If you’re panicking today, then you don’t even know what a correction is. The action on your screen today is perfectly normal.” To be honest though, even seasoned professionals get nervous when the screen starts glowing red. This brings us to the second part of myopic loss aversion- the danger of checking your portfolio too often.
The More You Look, The Worse It Feels
Research has also shown that the frequency of observing losses is directly related to loss aversion. That is, the more you look at the screen glowing red, the worse it makes you feel. This can also drive you to focus more on short-term price movements as opposed to long-term trends. That’s the myopic, or nearsighted, part of myopic loss aversion.
 Source: pixabay.com
While most brokerage firms give you the ability to see intraday movements in your investments, the best advice is to check less frequently and more purposefully. Seth Godin noticed a smoking lounge in the Helsinki airport, and speculated as to when they may start building lounges for cell phone users. Perhaps we may need rooms for people compulsively checking their investment portfolios as well?
Avoiding Myopic Loss Aversion
Here are three things that an investor can do to minimize the impacts of myopic loss aversion:
1) Check your portfolio less frequently.
For short-term traders, by definition you need to review short-term price fluctuations as the intraday volatility is what provides opportunities. But I’ve found that many long-term investors still check their portfolios intraday, similar to our tendency to check e-mail way too often (a subject for another post). Pay less attention to short-term moves, and set price alerts to let you know when you need to pay more attention.
2) Always review longer-term price charts.
If your go-to chart is a 5-minute chart, then also check an hourly or daily chart. If you start with a daily chart, review the weekly and monthly charts. While one bar can appear to have a huge impact on a stock, the longer-term time frame will help you put that one bar into perspective and understand the longer-term trend in place.
3) Review key support levels for your stocks.
I’ve always taught people to start at the right side of the chart and work your way left. Charles Dow taught us that an uptrend is a series of higher highs and higher lows. By keying in on specific support levels, you’ll know at what price point to review your position.
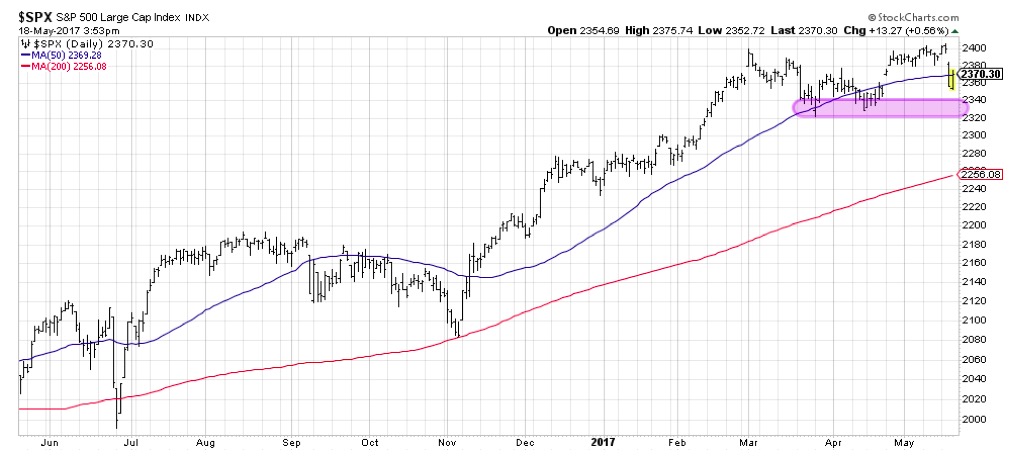 For the S&P 500, as long as the index stays above the previous support range of 2320-2340, the uptrend remains intact.
David Keller, CMT
marketmisbehavior.com
David Keller, CMT is passionate about viewing the markets through the lenses of behavioral psychology and technical analysis. He is a Past President of the Market Technicians Association and currently serves as a Subject Matter Expert for Behavioral Finance. David was formerly a Managing Director of Research at Fidelity Investments in Boston as well as a technical analysis specialist for Bloomberg in New York. You can follow his thinking at marketmisbehavior.com
Disclaimer: This blog is for educational purposes only, and should not be construed as financial advice. The ideas and strategies should never be used without first assessing your own personal and financial situation, or without consulting a financial professional.
