
SPX Monitoring purposes; Short SPX on 8/30/17 at 2457.59.
Monitoring purposes GOLD: Neutral
Long Term Trend monitor purposes: Neutral.
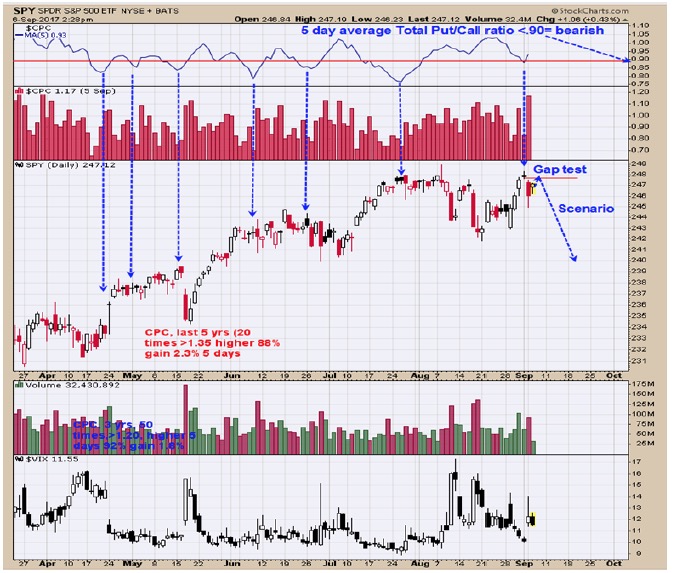
The top window is the 5 day average of the “Total Put/Call ratio”. Readings .90 and less have appears near short term highs in the market, which was reached last Friday. Market moved lower on Tuesday on high volume and a bearish sign. A down gap formed on Tuesday’s open and market is attempting to test that gap level which is near 248 on the SPY. If the gap is tested on at least 10% lighter volume, than gap will have resistance (which appears likely) and market may turn back down. Market bottoms form on panic which we define as a TRIN reading close greater than 1.50 and a Tick close less than minus 300. Yesterday’s TRIN closed at .68 and tick closed at -59 suggesting no worthwhile bottom formed yesterday. We have a minimum downside target near 2400 on the SPX. Short SPX on 8/30/17 at 2457.59.
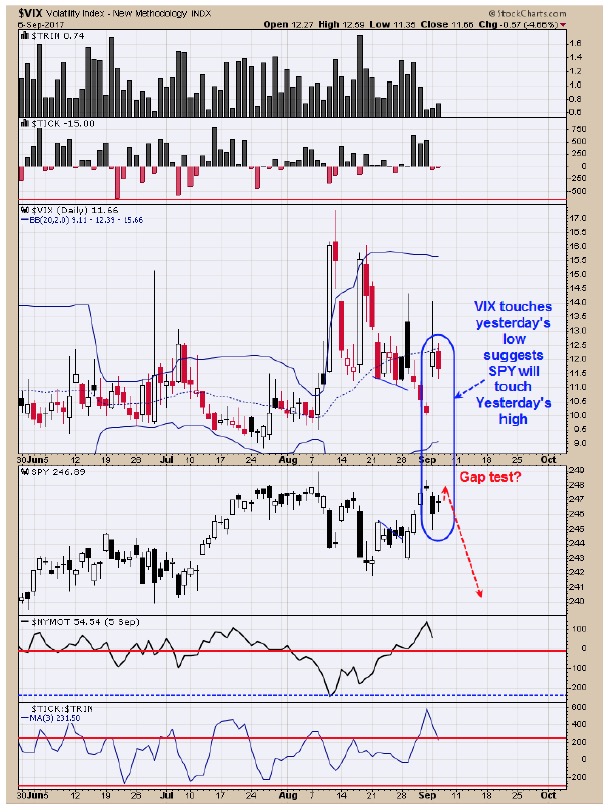 It is said that VIX leads the way for SPY in the opposite direction. Today the VIX tested yesterday’s low suggesting at some point SPY will test Yesterday’s high. Yesterday the SPY gapped down leaving an open gap near 248 range on the SPY which is at yesterday’s high. With the VIX testing yesterday’s low, a SPY test of yesterday’s high is probable. If the test come on lighter volume will imply resistance and then the decline may resume. Short SPX on 8/30/17 at 2457.59
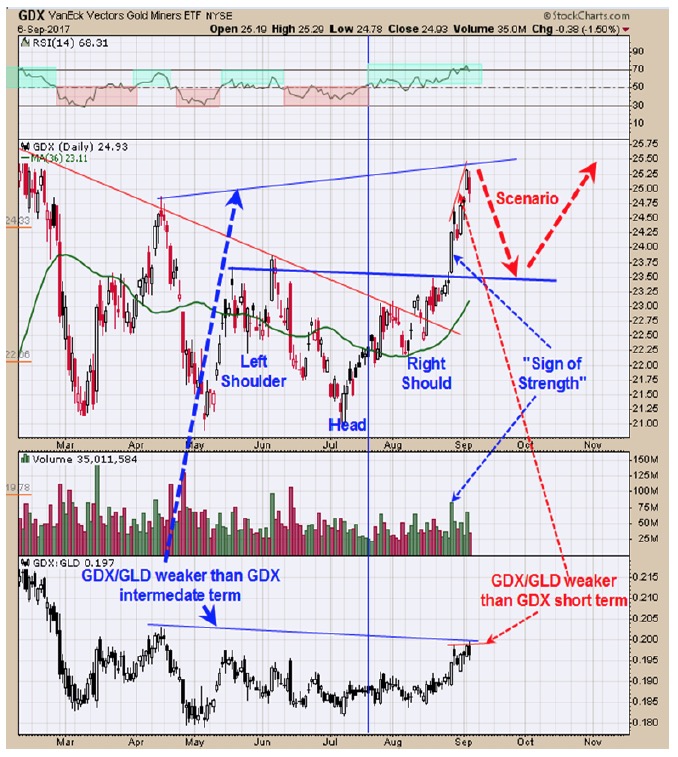 The July low appears to have been a “Head” of a “Head and Shoulders bottom”. The “Neckline” of this pattern was broke with a “Sign of Strength” can confirms the pattern. In bullish moves for gold and gold stocks the Gold stocks outperform gold which is indicated by the GDX/GLD ratio rising. GDX broke above the April high and the GDX/GLD ratio has not, showing that GDX/GLD ratio is weaker than GDX and a bearish divergence. Also notice that GDX it above Last Tuesday high and GDX/GLD ratio is not; showing a short term divergence. What this could mean is for a short term pull back to support near the Neckline at the 23.50 range before moving higher again. If the pull back does materialize and the GDX/GLD ratio shows strength compared to GDX, a bullish setup could form. The longer term patterns are bullish but the shorter term patterns are not ideal. Still neutral for now.”
Tim Ord,
Editor
Examples in how "Ord-Volume" works, visit www.ord-oracle.com. New Book release "The Secret Science of Price and Volume" by Timothy Ord, buy on www.Amazon.com.