SPX Monitoring purposes; Neutral.
Monitoring purposes GOLD: Long GDX on 1/29/19 at 21.96.
Long Term Trend SPX monitor purposes; Long SPX on 10-19-18 at 2767.78
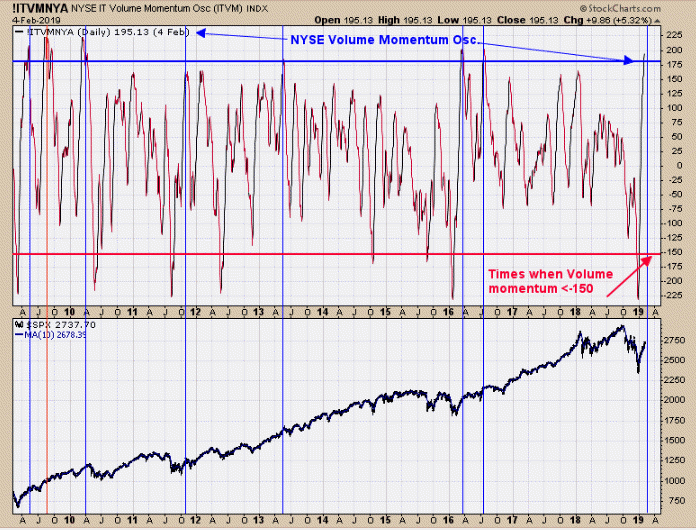
 According to Urban Carmel (@ukarlewitz), "SPX up 5 day in a row, Since 2011, N = 33 times. SPX closed higher within next five days in all except one (97% success).” The graph above shows the NYSE intermediate-term volume momentum oscillator. When this oscillator gets above 185 (the current reading is 195.13), it means the market is near a stall phase, if not a short-term top. What this chart tells us is that the next resistance area is near the 2800 SPX range, which is where the November, December highs may stall the market. The State of the Union address is tonight, which could produce a reaction in the market on Wednesday. If there is a reaction the “five day up rule,” that suggests one should buy the market and that the test of the 2800 SPX level should mark resistance as the NYSE intermediate-term Volume Momentum Oscillator is extended. This is just a theory; let's see what develops.
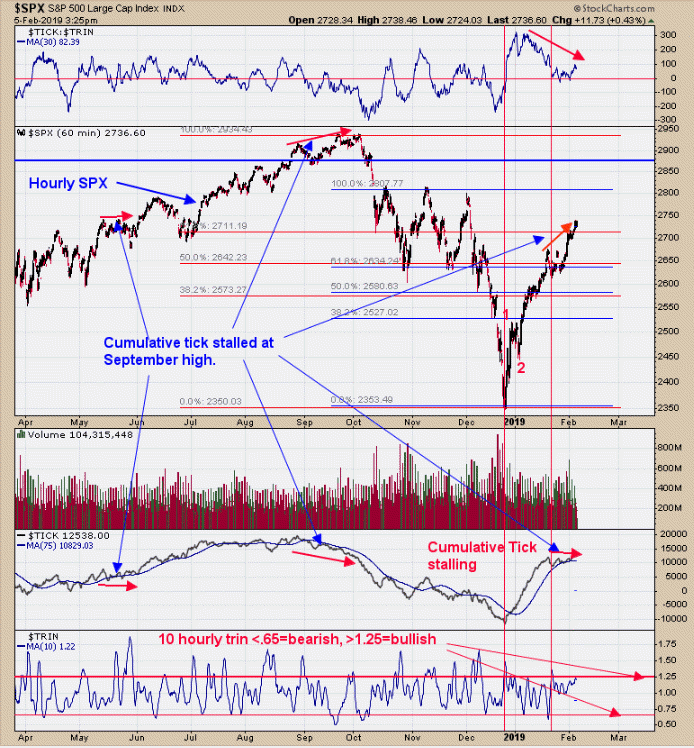
 Yesterday. we said “when the Cumulative TICK is rising, then that is usually a bullish sign for the SPY and when declining a bearish sign. The middle window is the hourly SPX and below that the hourly Cumulative TICK. Since mid-January the SPX has pushed modestly higher and the Cumulative TICK worked sideways. We have two other times in the last six months where the SPX moved higher and the TICKs went sideways or declined and one of those times came at the September highs.” The bottom window is the 10-hour moving average of the TRIN. Readings above 1.25 have been a bullish sign for the market and below .65 have been bearish (the current reading is 1.23). The State of the Union address is tonight and could have an effect on the markets. With the 10-hour TRIN near the 1.25 bullish level, it would suggest that, if there is a pull back, it should be bought. The bigger picture is bullish but the short-term trend is unclear.
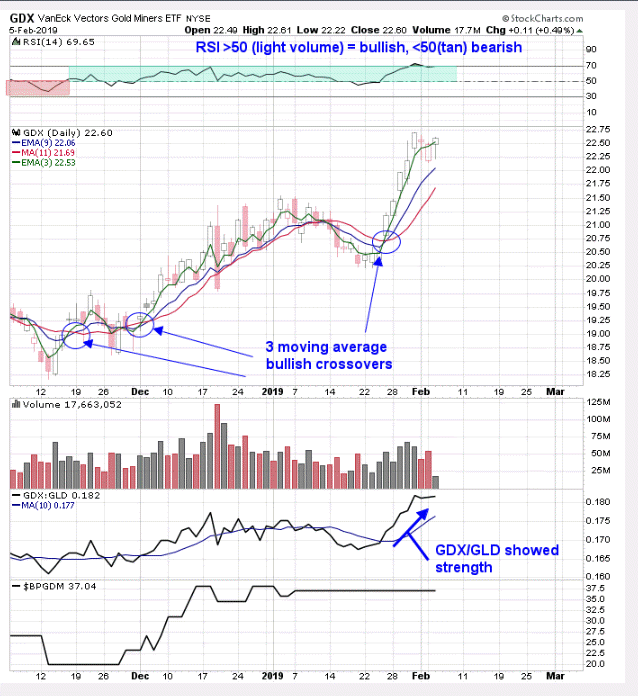
 Above is a short term view of GDX. The top window is the RSI for GDX. Readings above RSI 50 are bullish (light blue) and those below 50 are bearish (TAN); right now the RSI is hovering near the 70 range at a sold bullish level. We have three moving averages on GDX, which are the 3-, 9-, and 11-period MAs. When all three either cross to the upside or cross to the downside, a bullish or bearish signal is triggered. In late January, all three crossed to the upside, triggering a bullish signal and remaining on the bullish signal. The second window up from the bottom is the GDX/GLD ratio, with a 10-period moving average. The GDX/GLD ratio crossed above its 10-period moving average, which triggered a bullish crossover. As it sets now, the short-term picture remains bullish and higher prices are expected. Long GDX on 1/29/19 at 21.97.
Tim Ord,
Editor
www.ord-oracle.com. New Book release "The Secret Science of Price and Volume" by Timothy Ord, buy at www.Amazon.com.
