SPX Monitoring purposes; Sold SPX on 2/12/19 at 2744.73 gain 1.36%; long 2707.89 on 2-8-19.
Monitoring purposes GOLD: Long GDX on 1/29/19 at 21.96.
Long Term Trend SPX monitor purposes; Long SPX on 10-19-18 at 2767.78
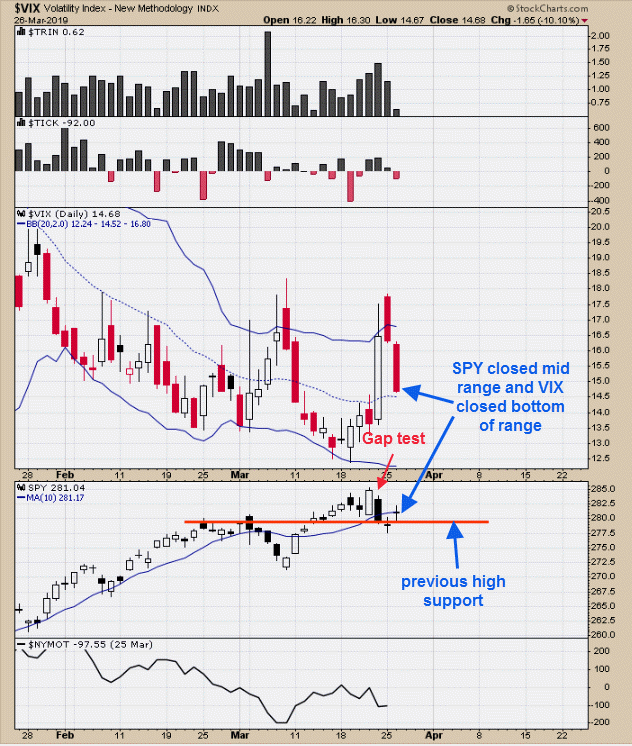
 VIX trades in opposition to SPY and can give clues of what the SPY may do next. Back in October 2018, the SPY made a lower low and VIX matched its previous high and a bullish divergence for the SPY, suggesting a low. In November-early December, the SPY matched its previous low and VIX made a higher high, suggesting SPY may make a lower low (and it did). The SPY is matching its December high and the VIX is making a lower low compared to its December low and a bullish divergence. This condition suggests the SPY may not retrace much of its advance and, once the retracement is done, the VIX suggests the SPY will exceed its December high (the 2800 SPX range). The market could flip sideways. We will wait for a clearer setup.
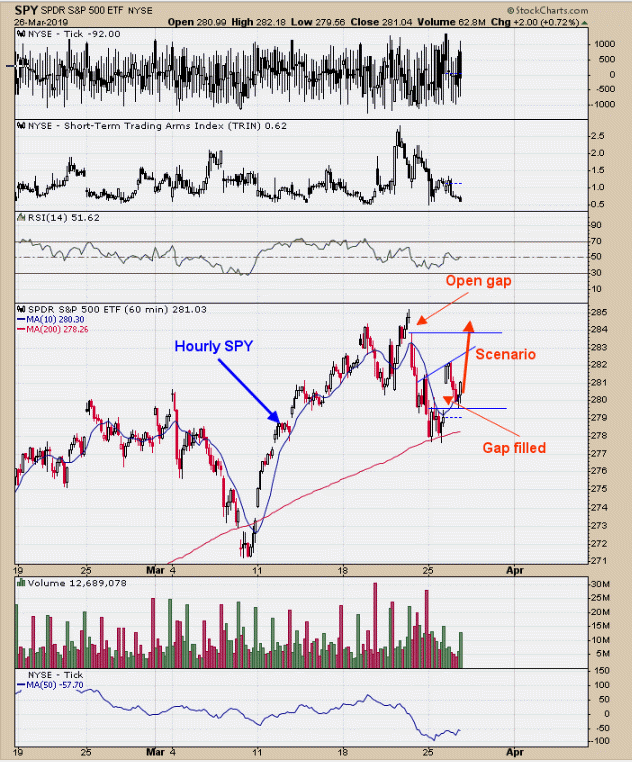
 The top window is the 100-hour moving average of the tick. When the 100-hour tick is above “0,” generally the SPX is moving higher and below “0” the market may be moving lower. The 100-hour tick has turned down but is still above “0,” suggesting that the market is weakening but still in an uptrend. The bottom window is the 30-hour moving average and the same rules apply. This shorter-term moving average has fallen below “0," a short term bearish sign. Next window up is the hourly cumulative tick. The cumulative tick rises and falls as the SPX rises and falls. Over the last couple of weeks, the cumulative tick increased its angle of rising, showing strength, but over the last couple of days it has rolled over and is nearing its moving average. The SPX has reached its November-December high near the 2800 range and a resistance area. The different configurations of the tick are starting to show weakness. Support is near the 200-day moving average, which is near the 2725 SPX range.
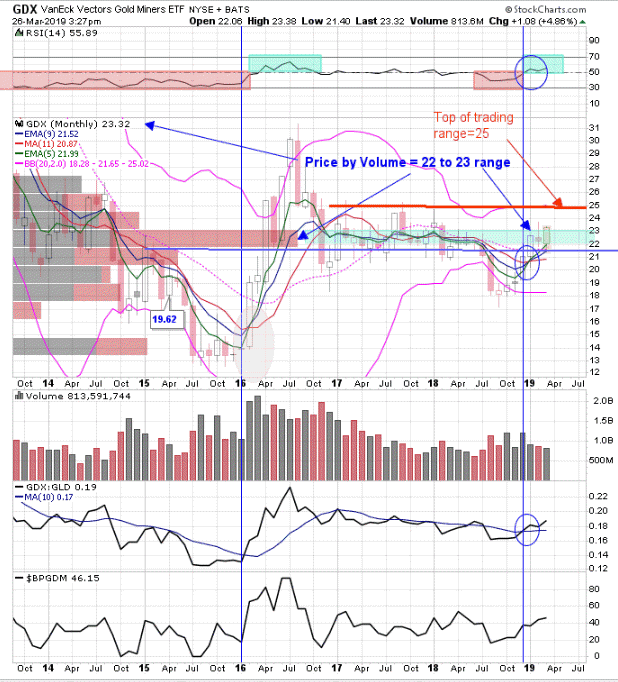
 Here is the monthly GLD chart (ETF for Gold). The pattern forming appears to be a head-and-shoulders bottom where the head formed at the 2016 low. The right shoulder appears near completion and testing the “Neckline.” For confirmation of a head-and-shoulders bottom, a “Sign of Strength” through the “Neckline” is needed. A “Sign of Strength” is a high-volume, wide price spread through the “Neckline” price. Looking at the monthly price volume from the low in November 2018, the market has been up four months in a row (green bars), which is a show of strength. GLD could hesitate near current prices, but a surge in strength should commence in the coming weeks to confirm the head-and-shoulders bottom. The top window is the monthly RSI for GLD; readings above 50 suggest GLD is in an uptrend and the current reading is 57.31. Long GDX on 1/29/19 at 21.97.
Tim Ord,
Editor
www.ord-oracle.com. New Book release "The Secret Science of Price and Volume" by Timothy Ord, buy at www.Amazon.com.
