
SPX Monitoring purposes: Flat.
Monitoring purposes GOLD: Long GDX on 1/29/19 at 21.96.
Long Term Trend SPX monitor purposes: Sold long term SPX on 10/24/19 at 3010.29=gain 1.49%; Long SPX on 10/14/19 at 2966.15.
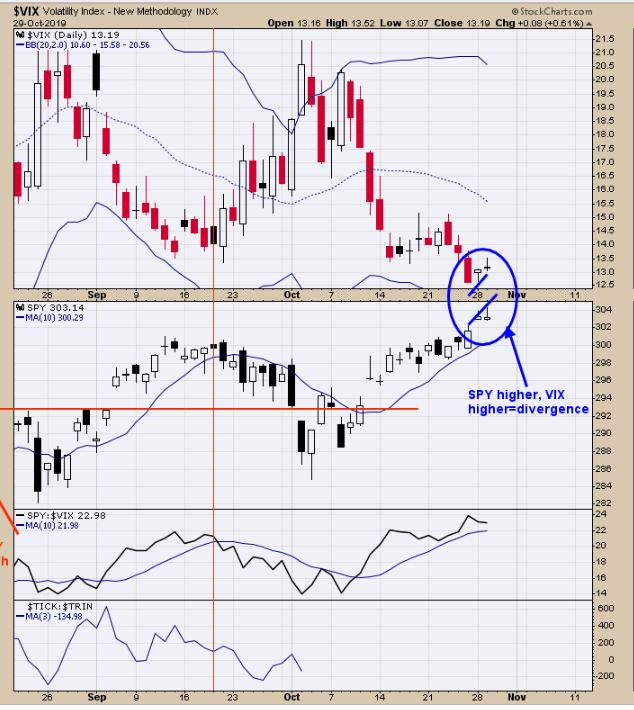
In the last couple of days, the SPY closed near a new high and the VIX closed higher during the last two days, which sets up another divergence. The FOMC meeting announcement is tomorrow around 2:00 eastern. The small divergence in the VIX, SPY divergence may setup a minor pullback. We will wait and see what develops. The bigger trend is up and short-term tend is questionable.
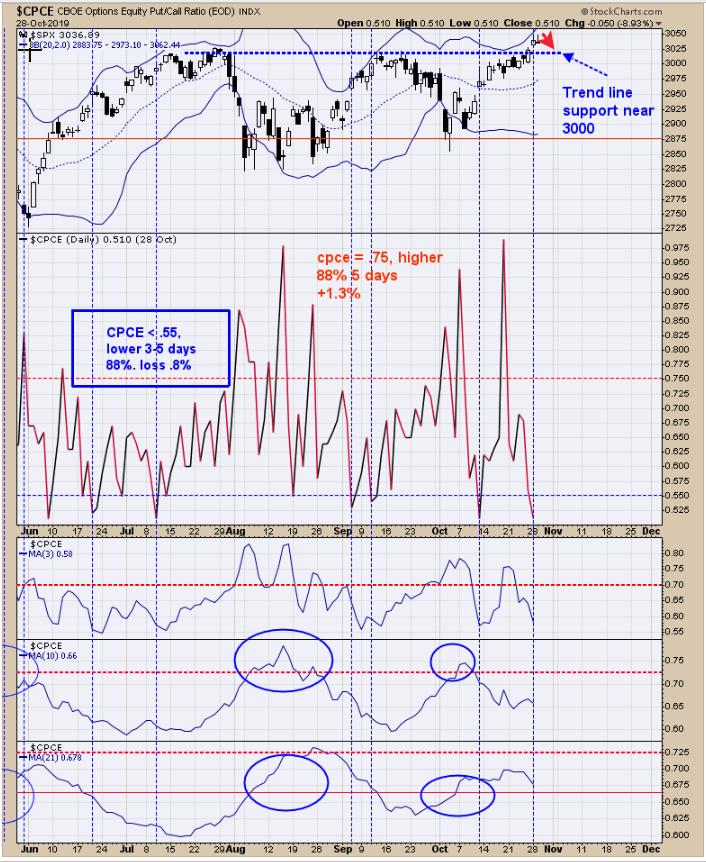
Yesterday we looked at the Total Put/Call ratio (CPC). Readings below .80 (yesterday's reading was .78) can market minor short term highs. CPC also hit .78 last Thursday. Readings less than .80 have an 85% probability of an average .7% pull back in the next five days. Above is the Equity Put/Call (CPCE) which closed yesterday at .51; CPCE .55 and lower produce .8% average pullback with in 5 days 88% of the time. These sentiment readings suggest caution in the short term. The SPX was up four days in a row going into yesterday. The SPX was higher within 5 days 81% of the time. It doesn't look like a top is forming here (maybe a pullback to support near SPX 3000) than a drift upcoming.
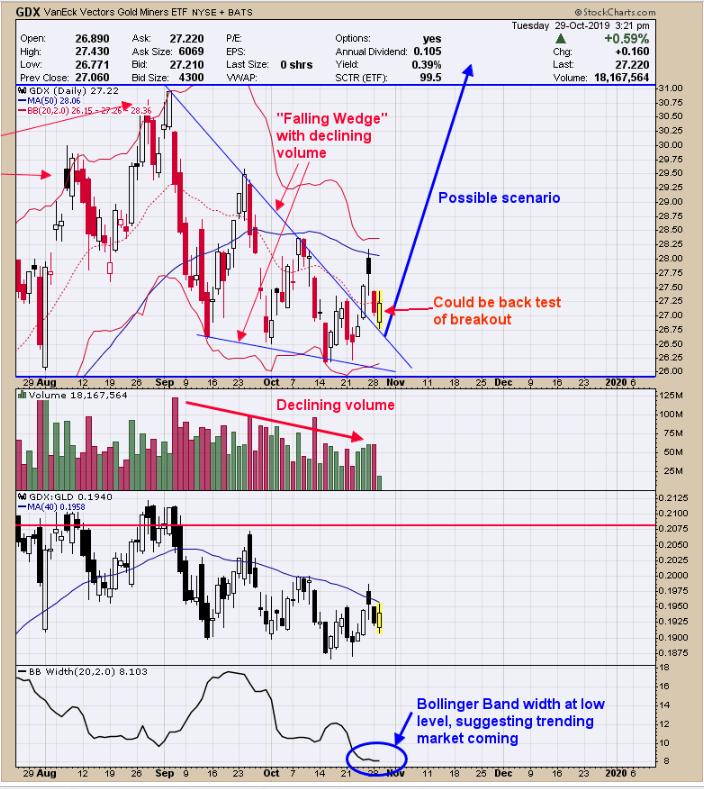
We have updated this chart from yesterday. Yesterday, we said "The pattern that appears to be forming on GDX from the September high is a "Falling Wedge". This pattern can be described by lower high and lowers lows that meet out into an "Apex". As the market works towards the "Apex" the volume gradually decreases. This matches the GDX pattern. Last Thursday GDX broke above the downtrend line from the September high and could be the "Breakout" that suggests the bottom is in. Today's pullback could be the "back test" of the breakout level and should find support in this region. The bottom window is the "Bollinger Band width" which is at a low level. Low levels in the Bollinger Band Width suggests a trending market is coming and most liking the "Trending market" will be up. "Falling Wedges" have upside target to where the pattern began; which in this case is the September higher near 31.00. GDX could go higher but that is the first target for the next resistance." Today's low finding support at the down-sloping trend line from the September high adds to the bullish breakout scenario. Long GDX on 1/29/19 at 21.97.
Tim Ord,
Editor
www.ord-oracle.com. New Book release "The Secret Science of Price and Volume" by Timothy Ord, buy at www.Amazon.com.