
SPX Monitoring purposes: Flat.
Monitoring purposes GOLD: Long GDX on 1/29/19 at 21.96.
Long Term Trend SPX monitor purposes: Long SPX on 10/14/19 at 2966.15.
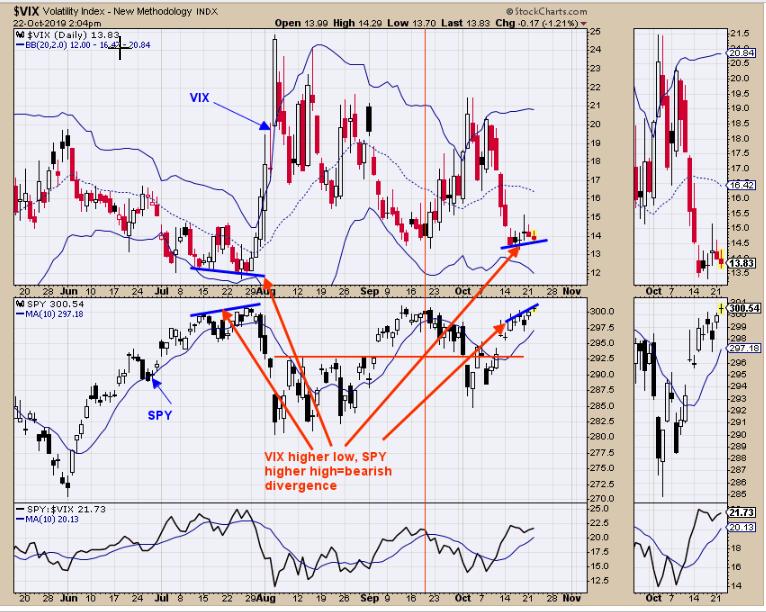
Yesterday, we said that "[t]here are 500 components in the SPX and when over 350 of those components respond in a SPX rally then that is considered a "Sign of Strength" (SOS). Last week an (SOS) was recorded suggesting there is more to come of this rally. Sometimes there are pull backs before the rally starts and pull back down to fill last week gap near 2950 range is possible before market heads higher." Above is the VIX, which trades opposite of the SPY; when they trade together, a divergence is present. Over the last week, the VIX has made higher lows as SPY made higher highs, suggesting a pullback is possible for the SPY. This same setup occurred back at the July high (noted on the chart). This divergence adds weight to the 2950 pullback scenario.
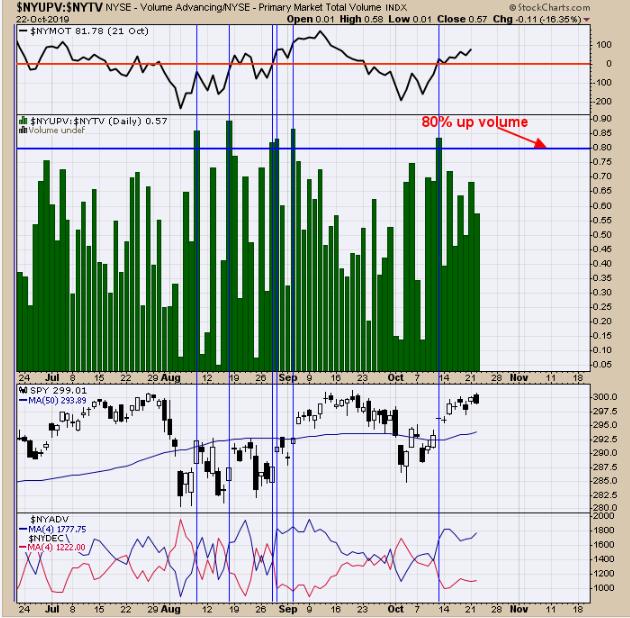
The middle window is the NYSE Up Volume/NYSE Total Volume ratio. When up volume of total volume reaches above 80%, it considered a "Sign of Strength" and a bullish sign going forward for the market. Back in August and early September, as well as a couple of weeks ago, this ratio did reach above 80%, suggesting an intermediate-term low was forming. The top window is the NYSE McClellan Oscillator. Readings above "0" on the McClellan Oscillator show the market is in an uptrend (current reading is 81.78). The market can stumble here but is not set up to far hard. A pullback to the 2950 SPX range is possible, but not much beyond that.
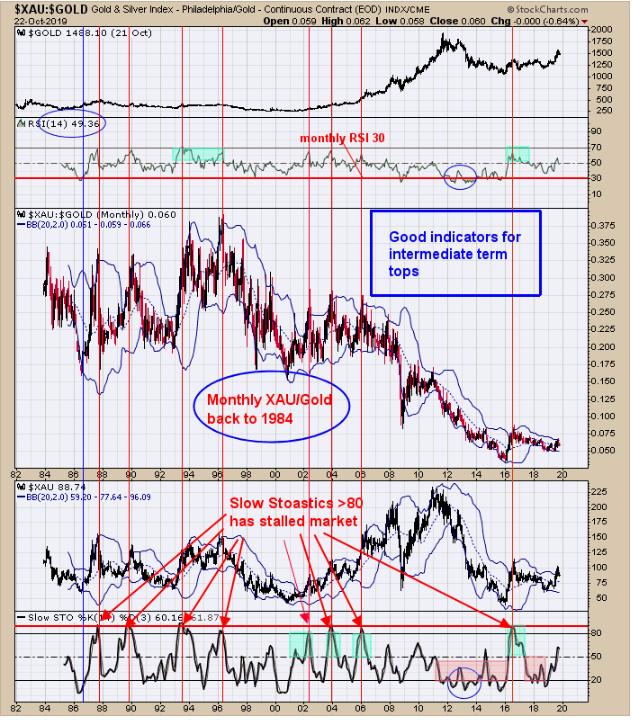
Above is a longer term indicator that has been good at identifying highs on the XAU. You can also see the monthly XAU/Gold ratio, and the bottom window is the monthly Slow Stochastic of the monthly XAU/Gold ratio. When the monthly slow stochastic of the XAU/Gold ratio reaches above 80, the XAU was near an intermediate-term high. This chart goes back to 1984 and the red horizontal lines identify the times when Slow Stochastic reached above 80. The current reading on the Slow Stochastic sits near 60 right now and the market has room to rally before this indicator reaches the 80 range. The last time the 80 range was hit on the monthly Slow stochastic was back in July of 2016, which was near the high on the XAU. This is one of the indicators we will be looking at as the market rally continues and will be a "heads up" if and when the slow stochastic reaches the 80 range. Long GDX on 1/29/19 at 21.97.
Tim Ord,
Editor
www.ord-oracle.com. New Book release "The Secret Science of Price and Volume" by Timothy Ord, buy at www.Amazon.com.