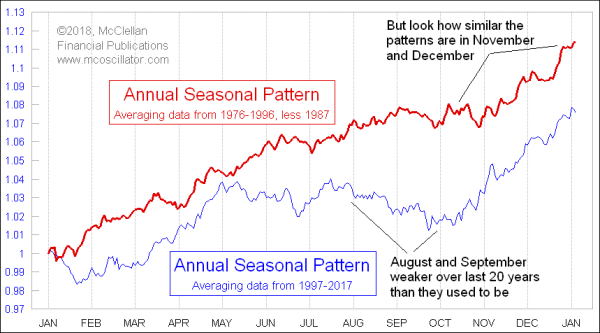
Just over a year ago, I wrote here about how annual seasonality has undergone a change compared to how it used to act years ago. We all know about how November-to-April is the strong period for seasonality, and then we are supposed to "Sell in May and go away." That was based on how things used to go, when the stock market would typically make a bottom in late October and then start higher.
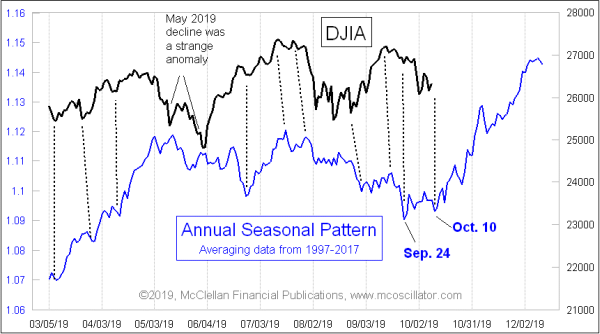
In recent years, though, the seasonal inflection point has been creeping to an earlier point on the calendar. For the 1997-2017 average pattern shown in this week's chart, the lowest point of the autumn seasonal weak spot is actually now Sep. 24. But that is "the bottom to go down into," while Oct. 10 is the "bottom to go up out of." Both of those are earlier than the late October bottom which used to be the norm years ago.

In the 1980s and 1990s, the "bottom to go up out of" used to be at the end of October. Why it is creeping to an earlier point now is an absolutely fascinating topic to ponder. Maybe it is related to the shift that has been occurring in the magnetic north pole. But we don't have to come up with an answer to the "why" question in order to recognize the "is" part of this change. It is happening.
And just ahead, the stock market in 2019 is about to hit that "bottom to go up out of" inflection point. This is all happening amid impeachment talk, trade negotiations with China going badly, ISM numbers that have come in lower than expected, JOLTS data also below expectations, the Fed realizing that there are problems (and starting QE3.5, which is "Not QE!!!" they tell us) and a myriad of other maladies affecting the stock market. The news always feels the worst at a bottom. When things cannot possibly get worse, that means they can only get better.
All of that is just empty commentary, however, to justify a stock market price outcome presumably unfolding as it has been doing on average during the past few years. Nothing says that the stock market has to comply. But still, it is a pretty compelling chart at the top of this article, showing how the dance steps of the DJIA in 2019 have been pretty closely approximating what the Annual Seasonal Pattern has been saying should happen. The bulls just need it to keep on working now as we head into the period of favorable seasonality.
