
SPX Monitoring purposes: Flat.
Monitoring purposes GOLD: Long GDX on 1/29/19 at 21.96.
Long Term Trend SPX monitor purposes: Sold long-term SPX on 10/24/19 at 3010.29=gain 1.49%; Long SPX on 10/14/19 at 2966.15.
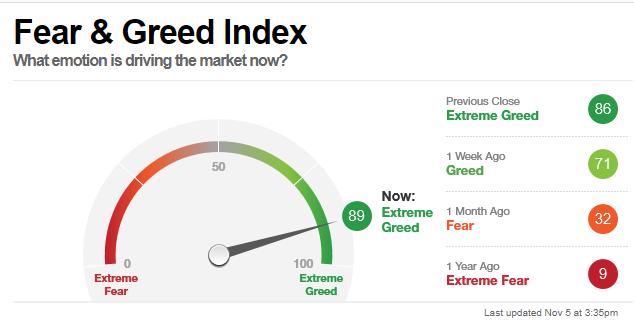 Source: CNN, 2019In our report yesterday, we said the market is getting "Frothy" per the CBOE Put/Call ratios in yesterday's report. Above is CNN's Fear & Greed index, which helps to point out the "Frothiness" in another way. The upside is limited for now and market needs to burn off that frothiness before it can move higher. Market declines don't usually begin until the McClellan Oscillators close below "0" (current reading is +66.25). Being patient for now.
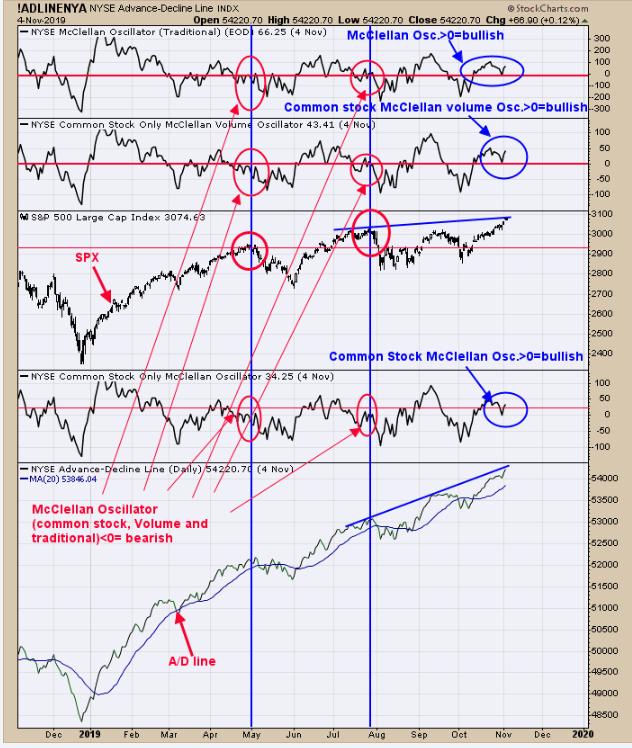
The point of the above chart is to show that market decline usually don't start with the McClellan Oscillator above "0". The top window is the NYSE McClellan Oscillator (traditional), which closed yesterday at +66.25. The next window down is the common-stock-only McClellan Volume Oscillator with a reading of +43.41. The second window up from the bottom is the common-stocks-only McClellan Oscillator, which closed at 34.25; all these McClellan Oscillator are above "0". We have circled the May and July SPX highs in red; notice that the all the McClellan Oscillators are below "0" and the market moved lower afterwards. Market is frothy here but is not set up for a decline - at least, not yet. Again, being patient for now.
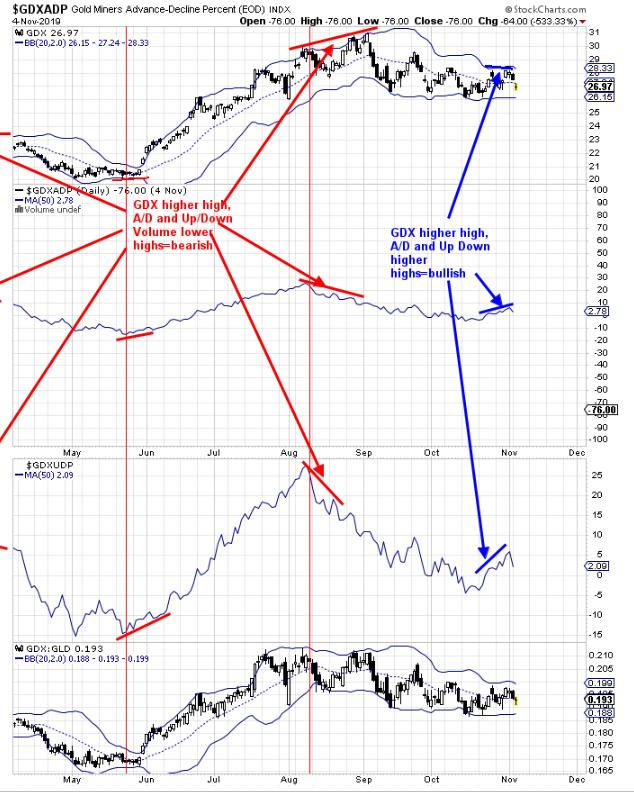
We showed this chart yesterday, but this one goes back 7 months instead of one year like yesterday. Back then, we said "[t]he second window down from the top is the GDX Advance/Decline Percent with a 50 day average. This indicator has been useful for reversal in GDX when there is a divergence. A divergence showed up at the late March and September highs where GDX made higher highs and Advance/Decline Percent made lower highs. The next window down is the GDX Up Down Volume percent with a 50 day average. This indicator works the same as the GDX Advance/Decline percent; when there is a divergence the market is nearing a reversal. Last week GDX produced a test of a previous high of the previous week. This test produced a higher high on the Advance/Decline percent as well as the Up Down Volume percent, showing the market is stronger on the second high and a bullish divergence. According to both indicators GDX should move higher short term." NEM earnings came out today and missed their estimate; stock fell nearly 4%. NEM represents 11.26% of GDX holdings. The internals for GDX look generally good. We don't have it shown, but the Bollinger Bandwidth is setting at a four-month low, suggesting a trending move in GDX is not far off. The pattern that appears to be forming on GDX is a bullish "Falling Wedge." This pattern has an upside target to where the pattern began, which in this case is near the 31.00 level. Long GDX on 1/29/19 at 21.97.
Tim Ord,
Editor
www.ord-oracle.com. New Book release "The Secret Science of Price and Volume" by Timothy Ord, buy at www.Amazon.com.