
SPX Monitoring purposes: Flat.
Monitoring purposes GOLD: Long GDX on 1/29/19 at 21.96.
Long Term Trend SPX monitor purposes: Sold long-term SPX on 10/24/19 at 3010.29=gain 1.49%; Long SPX on 10/14/19 at 2966.15.
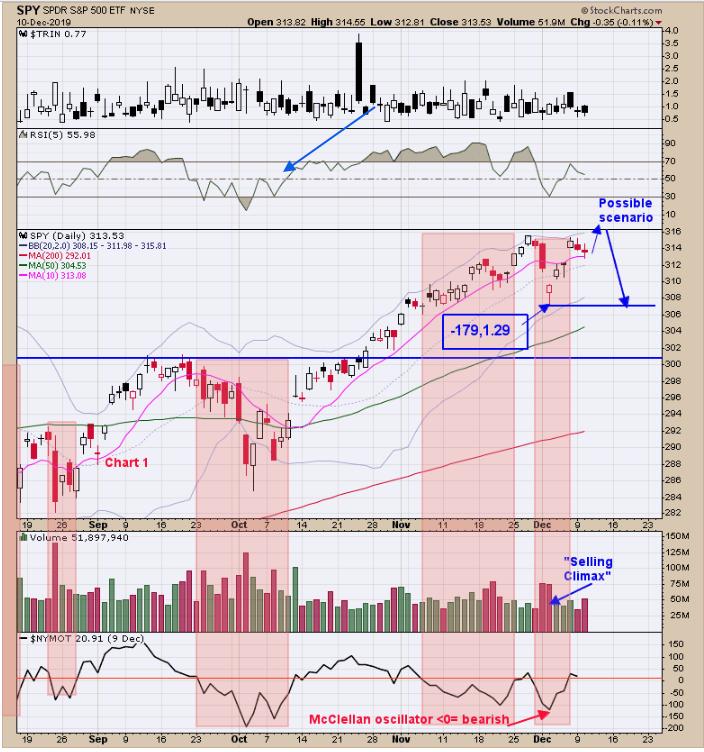
The FOMC meeting announcement will be made around 2:00 Eastern tomorrow and appears to be what the market is waiting for. On December 3, the TICKs closed at -179 and TRIN at 1.29, which are panic readings where short-term lows can form. SPY has bounced from that low. The FOMC could produce a bounce, as the VVIX/VIX turned up on days with the market being down, which is a short term positive divergence (see page two). The market could touch a new high short-term but our view will not go much higher. The tan areas are periods where the McClellan Oscillator is below "0" and normally a bearish sign. A bearish setup sign would be for the TICK close that exceeds +800 and the VVIX/VIX make a lower high as the SPY makes a higher.
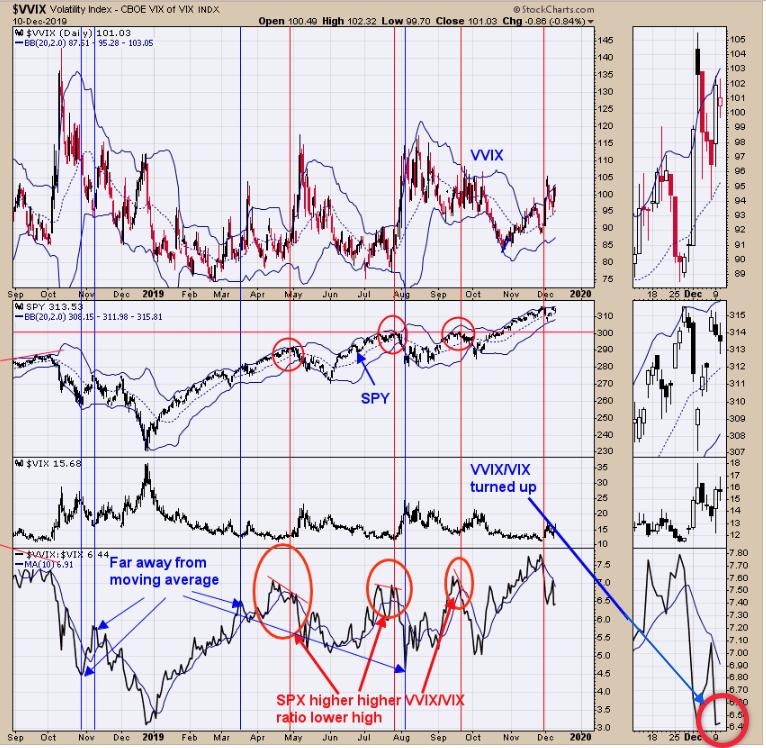
The bottom window is the VVIX/VIX. When divergences are present between the VVIX/VIX and the SPY, that means a reversal may be near. Today, the SPY was modestly down and the VVIX/VIX turned up, suggesting a bounce in the SPY is possible near term. The FOMC meeting announcement comes tomorrow near 2:00 Eastern and, if the VVIX/VIX is correct, a bounce is possible. If the SPY touches a new short-term high after the announcement (less than a ½ % higher) and VVIX/VIX fails to make a higher high (likely) along ideally TICK readings reaching extremes, could set up a bearish signal. Not looking for a big decline, but we could test last week's low near the 307 range on the SPY, which is about 2 ½% lower.
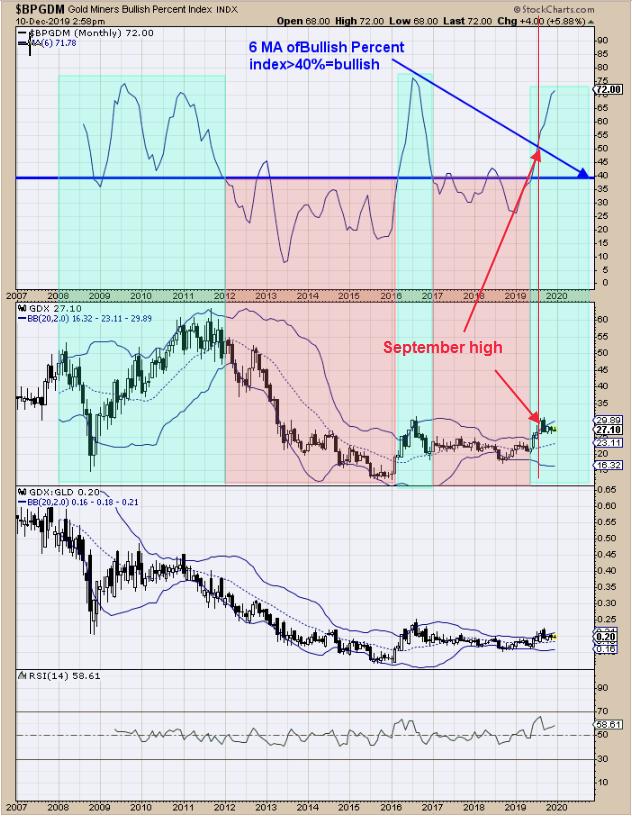
This is a very simple chart that looks at the bigger picture for the GDX market and what may unfold in the coming weeks. The top window is the monthly 6-period moving average of the Bullish Percent index for the Gold miners. When the monthly 6-period MA is above 40%, the directions for the Gold Miners index (along with GDX) is bullish. The current reading stands at 72% (meaning 72% of the stocks in the Gold miners index are on Point and Figure buy signals). GDX has been consolidating since the September high and the Bullish Percent index has actually moved higher, showing that the Gold Miners index (GDX) is getting stronger (more stocks on buy signals). This is more evidence that, once the consolidation ends for GDX, the impulse wave that proceeds a consolidation will be up. Long GDX on 1/29/19 at 21.97.
Tim Ord,
Editor
www.ord-oracle.com. New Book release "The Secret Science of Price and Volume" by Timothy Ord, buy at www.Amazon.com.