On February 19, 2020, I was a guest on David Keller's show The Final Bar on StockCharts TV. The two charts I presented were of the SP 500 Emini which combined intraday and longer term analysis. (Please feel free to view that episode, available on the StockCharts YouTube channel.)
At the time, there were causes for concern based on the process I use for analysis combining intraday and longer-term time frames. Many divergences and pattern types that tend to form at turning points were present.
As we all know now, the market has had a historic decline. The weekly charts of most indexes are straight down. We have not seen a measurable retracement rally thus far. My analysis is now pointing to a measurable rally in the works, which will hopefully break the extremely steep slope down on the weekly chart.
Let's take a look at some charts and some analysis.
A remarkable characteristic or trait of price movement is the "memory." Prices tend to return and test emotional points of price. These can be previous breakout areas, which we will walk through on this chart of the SP 500 Emini Weekly.
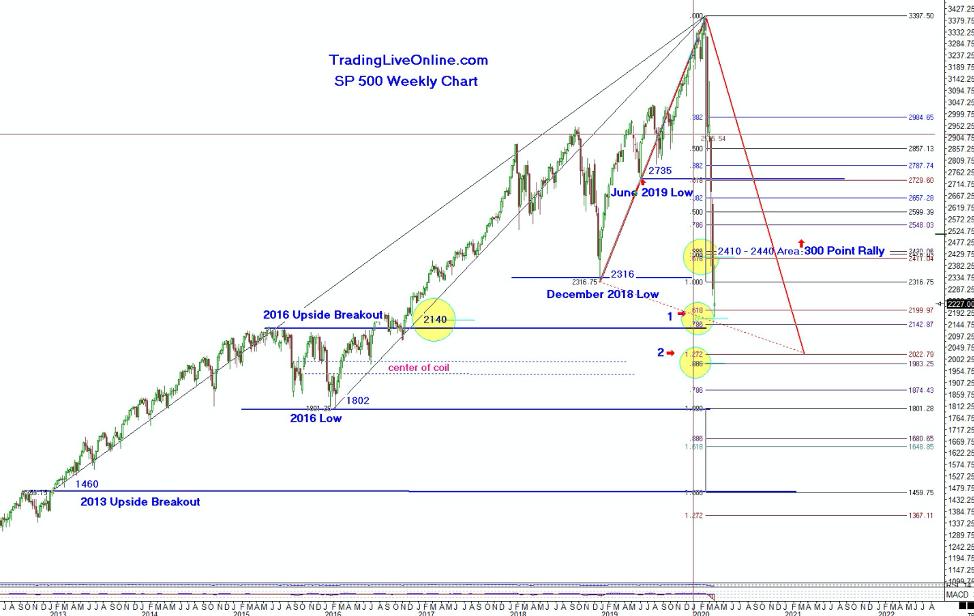
SP 500 Emini Weekly
You can see the area labeled 2016 Upside Breakout and 2016 Low. Price is now testing this previous range and upside breakout level. This was a range that formed over approximately one and a half years before a decisive upside move. There is a yellow circle (1) marking two Fibonacci retracement areas coinciding with this price level. As price has reached this level in the index, there are bearish divergences forming in the $VIX Daily, where the $VIX did not climb to another high as the index price made a low. There are bullish divergences starting to form in a progression of time frames. Momentum shifts occur on the smallest time frames first and work out to larger time frames. It should be noted that sometimes this process ends in smaller time frames when the larger time frames are not yet in gear for a shift. Eventually, all of the time frames will show signs of harmony in this progression and, usually, larger moves will come from this process, along with types of pattern recognition that are fractal. It is a bit of detective work.
Another thing marked on the chart, which will certainly be a price area to monitor if price declines prior to achieving a measurable rally, is the area marked as "center of coil." Prices tend to move back to centers of ranges as these areas are price levels that created many swings up, down and around.
The price level labeled, 2, to the right of this area is showing a 1.27 Fibonacci extension using the December 2018 low to the February 2020 highs. If you calculate the price length of this swing, multiply by 1.27 and subtract from the high, that will give the price projection of this extension. It is also coinciding with an .886 retracement from the 2016 low of the previous range. There are a number of confluences coming into the large range from 2016.
I'd like to point out that using this type of process can give signals too soon, but not necessarily unprofitable. If we look at the clustering just above the December 2018 price level, you will see 2410-2440 area. This area also showed some small intraday timeframe divergences and patterns, but the market did not make a strong enough rally up to break the steep down slope on this weekly chart. However, it did gain about a 300-point rally, which used to count for something in an environment of lower volatility.
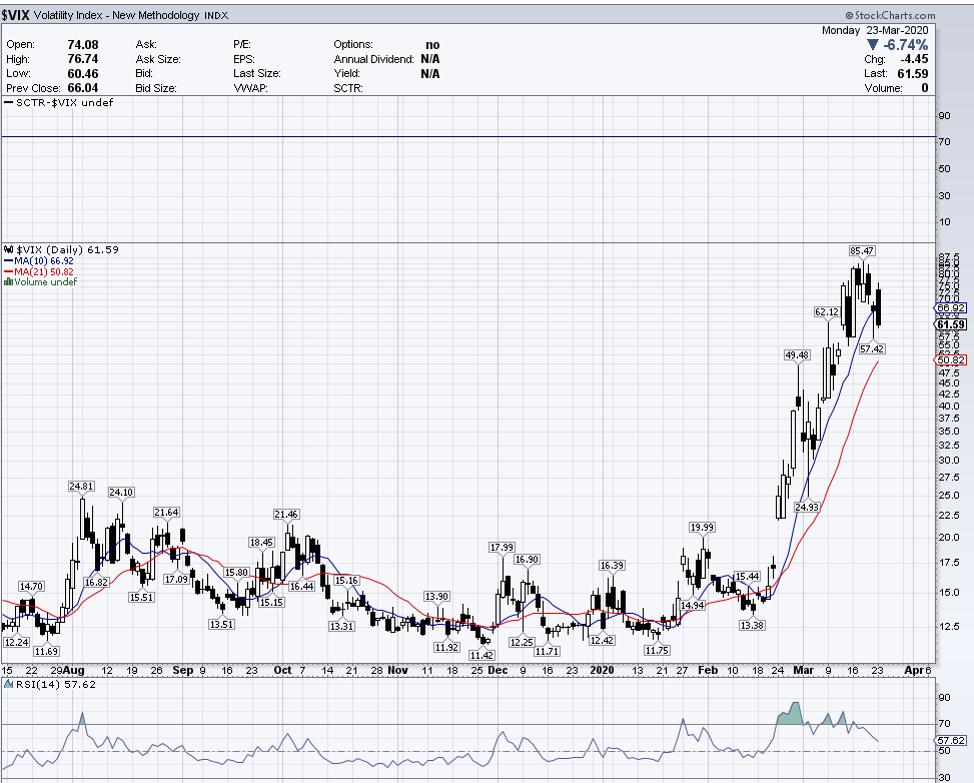
$VIX Daily
The next chart of the $VIX Weekly is showing it testing the 2009 highs. This is an extreme level of volatility and it would not be unreasonable to see a correction in the $VIX from these levels. The 2009 high in the $VIX is 89.53 and the March 2020 high so far has been 85.47.
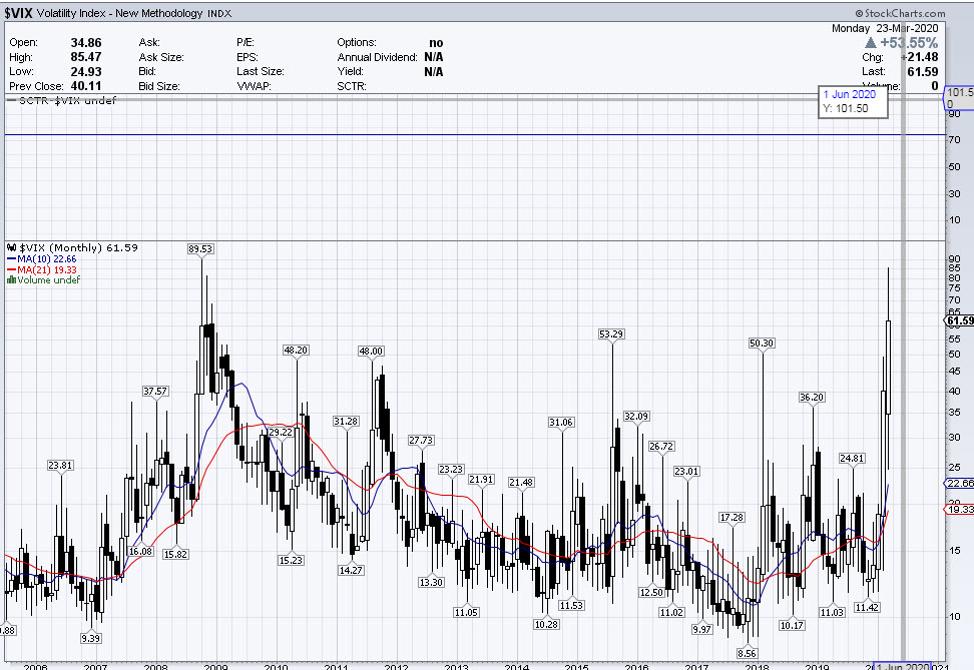
$VIX Weekly
The next chart is of the $NDX Daily, it is also showing bullish divergence, with price making a new low and RSI holding.
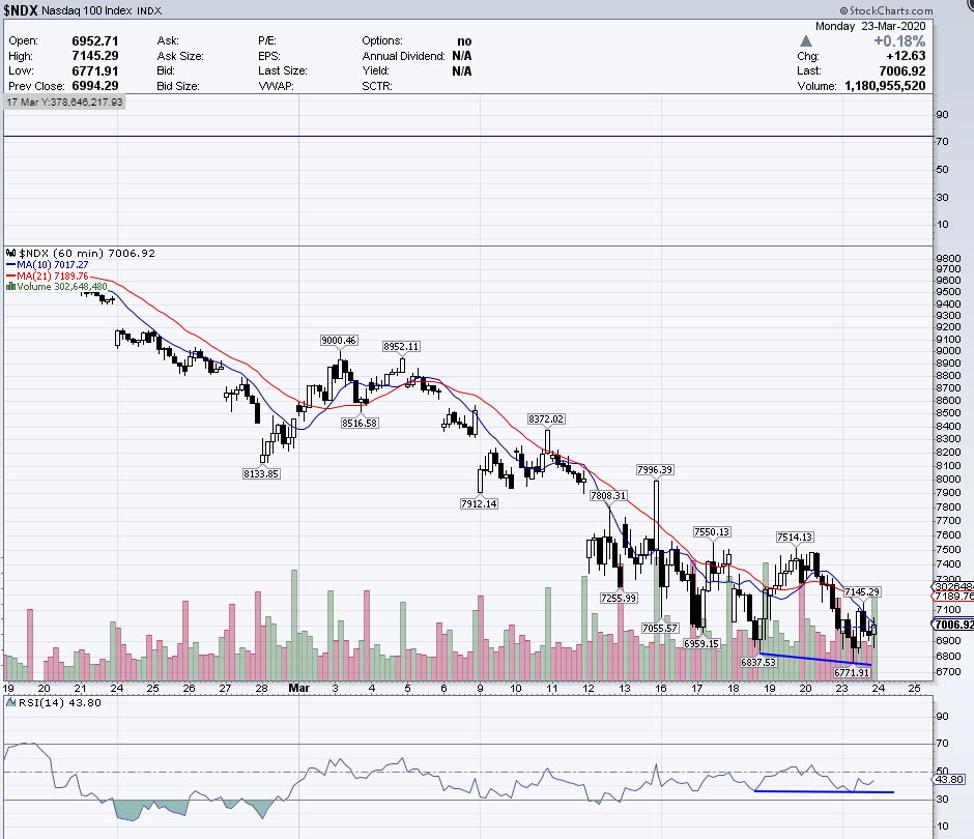
$NDX Daily
This next chart is a 120 minute of the SP 500 Emini. The top left of the chart is what we were seeing just before the drop in the markets. Note the labeling of the 1.27 extensions. Conversely, those are forming now around these areas of testing and potential support and hopefully prior to a larger rally.
RSI is also showing some bullish divergence.
If price dropped lower, then the next 1.27 extension would be around the 2116 area. Since there is so much volatility, prices can exceed these levels by 20, 30, 40 points or so and not invalidate the pattern. The closing prices are more important.
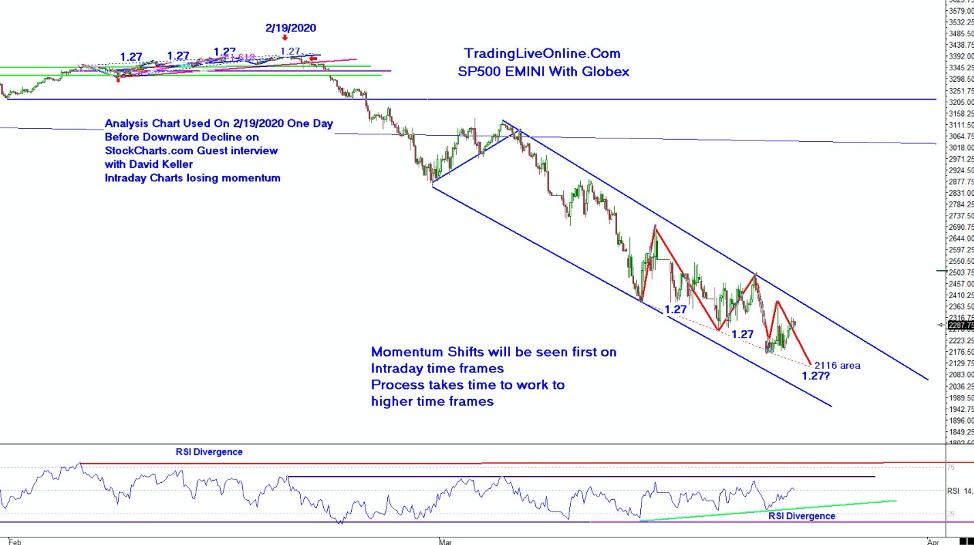
SP 500 Emini 120 Minute
Next is an intraday 20K tick chart of the SP 500 Emini. The price made a new low, and you can see the RSI line (within the horizontal blue lines) starting to climb upwards before price moved off those lows. Here we are seeing the market trying to make some upward progress, but so far being halted at the down sloping trend lines drawn in. As noted on the chart, the 2300 price level is current short-term resistance for the market to overcome before it can climb higher for a meaningful rally. Strongly moving above that level may be a signal for a stronger rally.
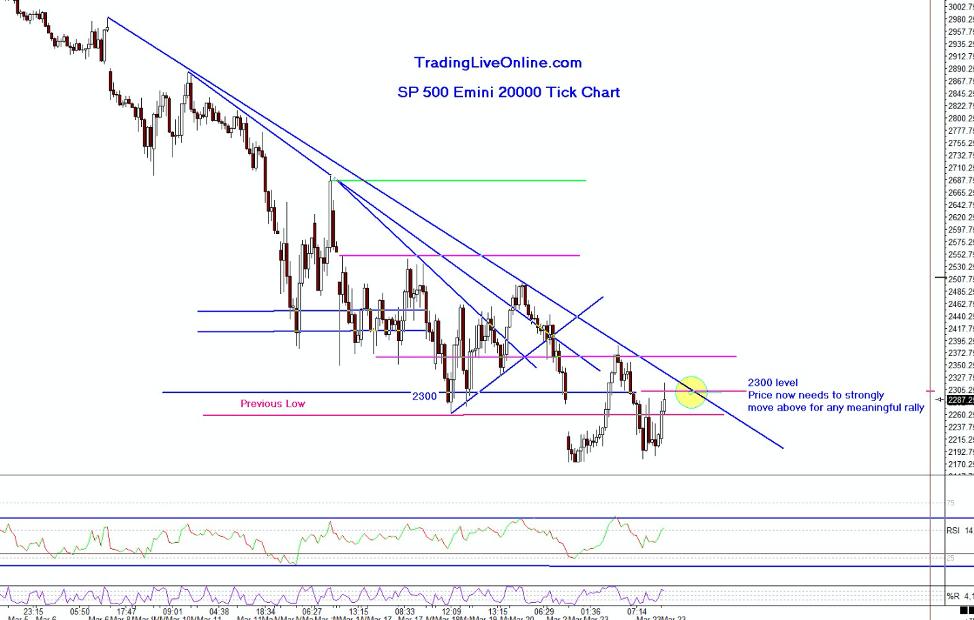
SP 500 Emini 20K Tick Chart
I never know what price "will" do, but a process of analyzing price behavior combined with pattern recognition can be an alert that something is shifting in the mood of price. Learning this type of process can help traders identify turning points as early as possible, which offers early entry points and lower risk points.
We will see over the coming days how these footprints play out.
If you would like to learn more, please feel free to contact me at ljouflas@msn.com or through www.TradingLiveOnline.com.
Best wishes for successful trading!
Leslie Jouflas, CMT