
The term "rogue wave" applies to strangely massive waves which occur in the ocean. And the same physics appears to show up in the movements of stock prices.
Oceanographers who study this phenomenon have observed that it is not just about a wave being very tall above the mean sea level. A rogue wave does have a crest, and it also has an adjacent trough which is approximately the same depth below normal sea level that the crest is above it. That is what makes a rogue wave so destructive to ships.
I first began to contemplate this topic as it relates to the financial markets after reading an article in National Geographic magazine about the Maxwave Project. It is included this chart, which is an actual plot of wave height measured in the ocean:

The operating hypothesis behind the formation of large rogue waves in the ocean is that a rogue wave "borrows" energy from adjacent waves, making them smaller, but making the rogue wave bigger. And, eventually, the rogue wave passes, allowing the chop to return to its normal amplitudes above and below sea level.
In looking at that chart, it occurred to me that I had seen this plot before. So, using a little bit of charting magic, I created this comparison:
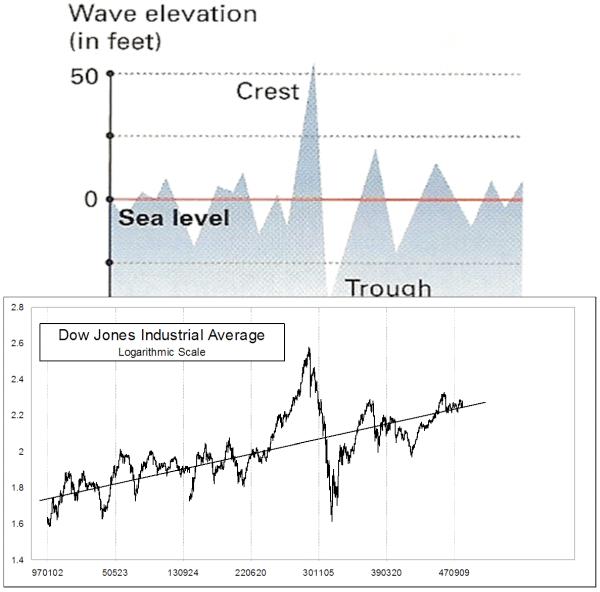
The key point to adapting this principle to the financial markets is that the notion of "sea level" is different. It does not have to be a flat price level, but rather perhaps a regression line which may be sloped upward or downward. Such is the case in that chart of the 1929-32 rogue wave event. And it is fun that the stock market "waves" before and after the big event looked a lot like the Maxwave plot.
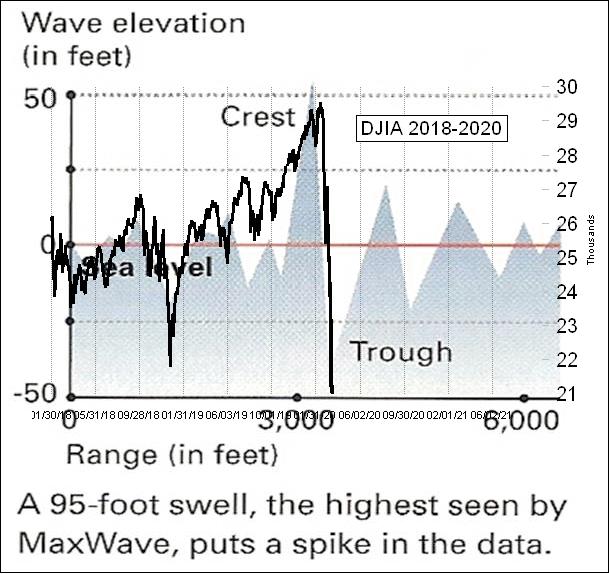
If one prefers, one can "flatten out" the stock market by portraying prices as the distance from some moving average, as opposed to raw prices. Here is an example of that technique, comparing the January 2018 "Short VIX Crash" to the Maxwave plot:

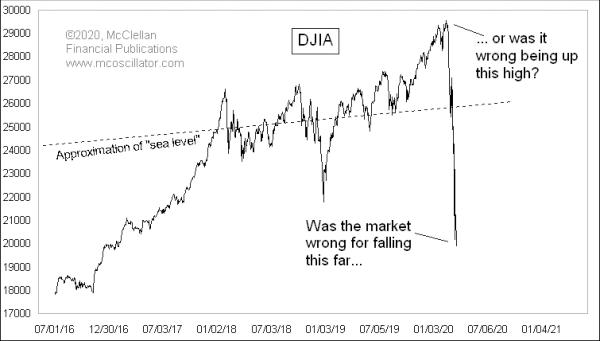
And here is a chart of the raw DJIA values from the current episode, again compared to that Maxwave plot:
If this interpretation is correct, that being that we are seeing another example of a rogue wave in the stock market, then the conclusion is that we should see some sort of return to "sea level" once the bottom is in. What price level constitutes "sea level" for this episode is a harder question to answer in advance. And, following that return to sea level, it is also possible that a new price trend could develop, upward or downward, which changes what the future "sea level" could look like.
From the first chart, though, if my hand-drawn middle line is approximately correct, then the bounce to get back to the current "sea level" would mean getting the DJIA back initially to around 26,000 to 27,000, just as a return to my guess about what sea level is for this instance. And that is just a guess.
To see how rogue waves have played out in other market scenarios, check out these prior articles.