
SPX Monitoring purposes: Sold SPX on 3/26/20 at 2630.07= gain 17.55%; Long SPX on 3/23/20 at 2237.40
Monitoring purposes GOLD: Flat
Long Term Trend SPX monitor purposes: Flat
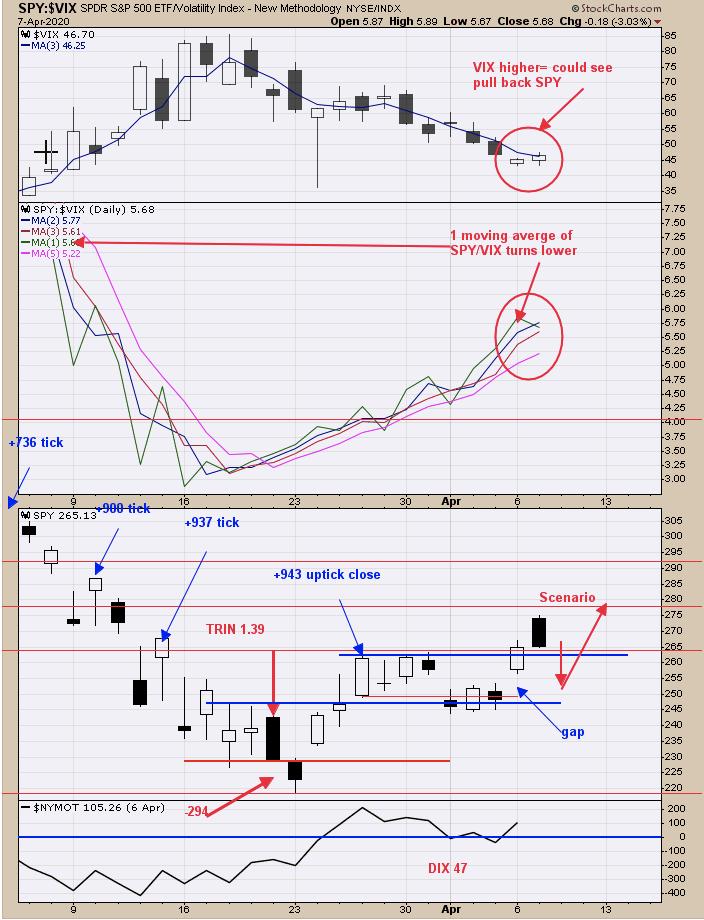
Today the SPY gapped up over 3%, then fell back, closing near-unchanged from yesterday. The top window is the VIX, which rose today despite the market being flat, which is a bearish sign. Monday's gap open may still be tested in the coming days and an area where a bullish setup could form. A setup would consist of a test of the gap day on lighter volume, along with a TRIN reading >1.30 and a TICK close < -200. Friday is Good Friday and markets are closed. Volume usually drops going into a holiday; tomorrow and Thursday may see light volume and an ideal time for Monday's gap to be tested. With a show of strength yesterday in the Up/Down volume and McClellan Oscillator remaining above "0", the uptrend for now is intact but a short term pull back is possible. Sold SPX 3/26/20 for gain of 17.55%.

Yesterday we said, "From the mid-March low to late March high, the McClellan Oscillator went from minus -400 to +200, which is a +600 Oscillator move. This surge in the Oscillator is a show of strength, one that usually leads to more strength short-term." Yesterday the Up Volume to Down Volume reached 10 to 1 (bottom window) and is another show of strength, but not usually how a rally ends. Yesterday, we concluded that a pull back to fill yesterday's gap open was a possibility, that possibility still exists. This coming weekend is a three-day holiday and todays marks a full moon; both conditions can take the wind out of the sails short term. Market may become quiet tomorrow and Thursday (Friday is a holiday). Signal could develop near gap level at 255 SPY range. Sold SPX position March 26 for a 17.55% gain.

The Bullish Percent index for the Gold Miners index stands at 80.77%; readings above 40% (40% of the stocks in the Gold Miners index that are on point and figure buy signals) are bullish for the index longer-term (chart not shown). If the Bullish Percent index holds above the 40% level in the coming weeks, it will suggests a GDX eventual breakout above the 31.00 level. Therefore, the longer-term looks bright. However, the short-term is not so bright. The second window up from the bottom is the GDX/GLD ratio. When this ratio is outperforming GDX, a bullish condition is represented for both gold and gold stocks. For nearly a month, GDX has made minor higher highs while GDX/GLD ratio has made lower highs and a short term bearish divergence, suggesting GDX may pull back short-term. GDX is also at resistance near the 26.00 level while this divergence is present, suggesting the 26.00 resistance level may hold. Being patient for now.
Tim Ord,
Editor
www.ord-oracle.com. New Book release "The Secret Science of Price and Volume" by Timothy Ord, buy at www.Amazon.com.