
SPX Monitoring purposes: Neutral
Monitoring purposes GOLD: Long GDX on 4/9/20 at 28.96.
Long Term Trend SPX monitor purposes: Flat
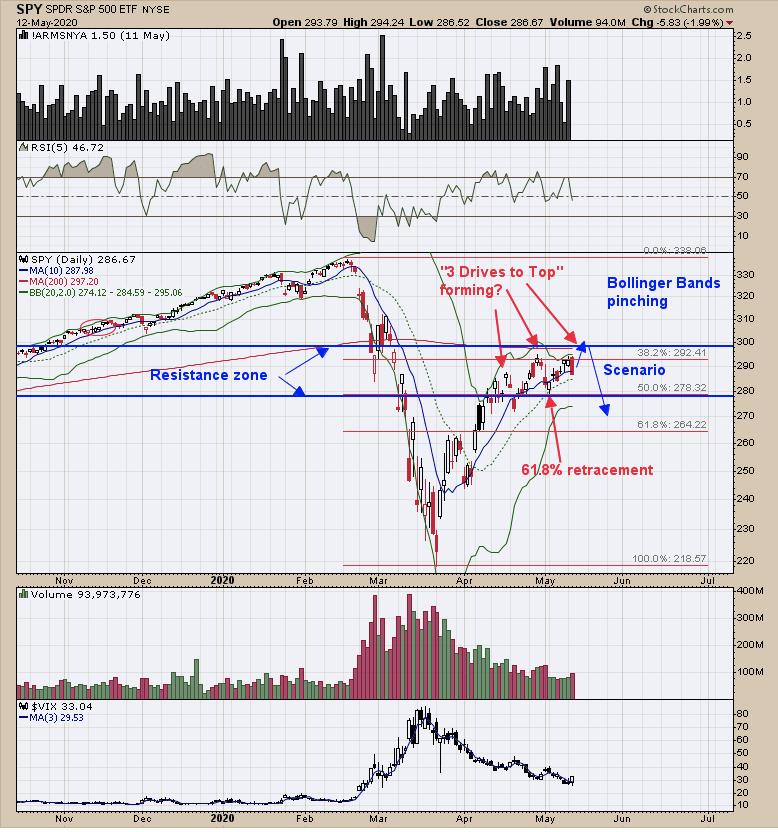
Yesterday we said, "The SPY retraced 61.8% of the previous major decline from the March 23 low, which stands at 292.41. SPY is also running into the resistance zone that formed back in mid-2019 that lasted near 5 months between 280 to 300 range on the SPY and added to that the 200 day moving average comes in at 297.25 and also a resistance level. These levels have the potential to form a resistance area where a potential sell signal could develop. The minor pullback that ended May 4, retraced 61.8% of the previous minor rally, showing upside is weakening. It's also one of the requirements for the second top retracement for a potential "Three Drives to Top" pattern. To complete this pattern, market would need to hit a new minor short-term high which hasn't happened yet." The McClellan Oscillator did close below "0" today, a bearish sign. Also, the Bollinger bands are starting to pinch, suggesting a large move in the market is not far off. Ideally, we would like to see SPY hit a minor new high to complete the "Three Drive to Top" pattern and, at the same time, for the VIX to make a higher low. Being patient for now.
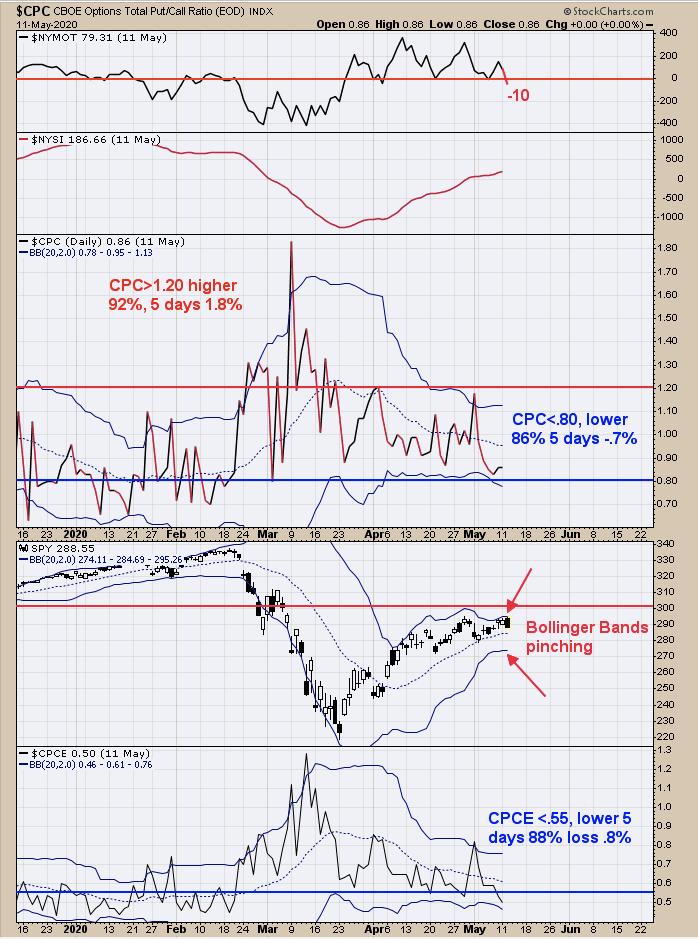
Sentiment is getting frothy. The bottom window is the CBOE equity put/call ratio; readings below .55 (currently .50) predict the market will be lower within 5 days, with an average loss of .8%. The next window up is the SPY with its Bollinger Bands, which are starting to pinch, suggesting a larger move is coming. The next window up is the CBOE Total Put/call ratio; readings near .80 (recent low .81) have led to a pullback that averages .7% within five days. The top window is the NYSE McClellan Oscillator, which closed below "0" and another bearish sign. NDX was up six days in a row going into yesterday, which predicts the market will make a higher close within five days 88% of the time. Also, remember that if the McClellan Summation index turns down before reaching +600, bad things can happen to the market. Yesterday's summation index stood at +175. Market appears near a setup.
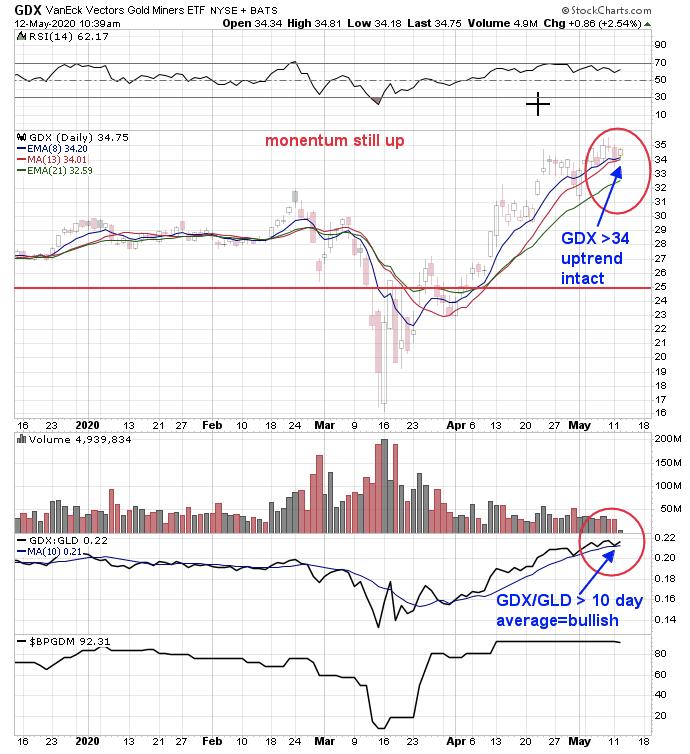
Above are a couple of momentum indicators. The second window up from the bottom is the GDX/GLD ratio with a 10-period moving average. As long as GDX/GLD ratio is above its 10-period moving average, the trend is considered up. On the daily GDX chart, we have moving averages of 8-, 13- and 21-period. GDX is above all three moving averages and remains in bullish mode. A fall below these moving averages will suggests momentum is weakening. The momentum picture remains bullish for now. Long GDX on 4/9/20 at 28.96.
Tim Ord,
Editor
www.ord-oracle.com. New Book release "The Secret Science of Price and Volume" by Timothy Ord, buy at www.Amazon.com.