On August 11, 2020, I was the guest host on StockCharts TV's Your Daily Five, where I had 10 minutes to present 5 charts. On that segment (watch here!), I discussed the Index divergences I was seeing. The $INDU was moving to the upside, but NASDAQ was showing weakness and the SP 500 Futures was showing a series of doji, smaller range bars on the daily chart.
The question is, will ALL indexes continue to make new all time highs in tandem, or will the NASDAQ continue to be the lone index at highs? And will the S&P 500 and $INDU fail at tests of previous highs?
To date, the NASDAQ is trading at new all-time highs, with a new high and closing high being made on August 17, 2020. However, the momentum is showing signs of weakening.
Market participants and technical analysts can never have 100% certainty of what price will do, but using analysis techniques and skills can be a benefit to determining clues. With that, we will look at some charts and graphs that are pointing to potential trouble ahead and possibly more time needed for ALL indexes to move in tandem.
Below is a link to a sentiment indicator, a convenient tool to gauge levels of Fear & Greed in the market. This tool is updated a few times a day. There are seven indicators used for the calculations; we will look at a few of them in this article.
https://money.cnn.com/data/fear-and-greed/
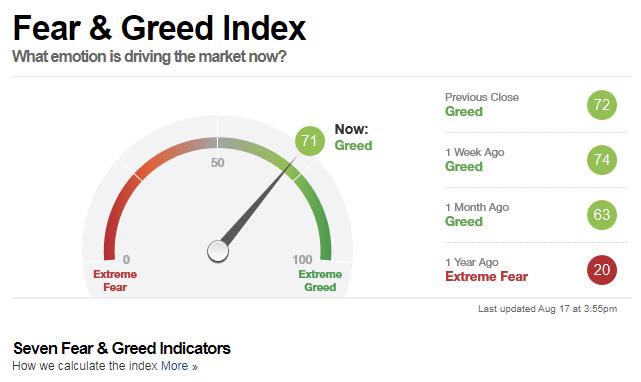 Chart 1 - Fear & Greed Index, Source: CNN
The sentiment is not at extreme levels, but is showing signs of excess greed. Sentiment indicators can be difficult to time market turns, but are useful in conjunction with other tools.
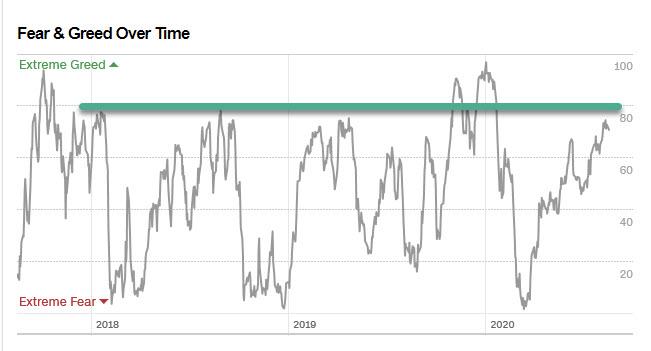 Chart 2 - Fear & Greed Over Time, Source: CNN
Note the horizontal green line drawn on the chart showing commonality of peaks. This indicator is very close to those peaks.
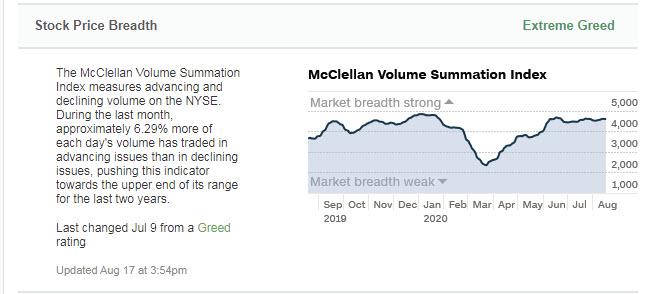 Chart 3 - Stock Price Breadth with the McClellan Volume Summation Index, Source: CNN
This Index is measuring advancing and declining volume and, as you can see, is near the level prior to the February 2020 decline.
I implement pattern recognition as a trading approach. This encompasses classic technical analysis patterns along with what are known as Harmonic patterns with Fibonacci ratios, such as the Gartley 222, AB=CD, Butterfly Pattern and others. Recently, I have been seeing many "Sell" patterns forming.
In my experience, multiple patterns tend to form around turning points. They can be early, but, when I start to see successive patterns on multiple timeframes, I pay attention.
Price tests around important highs and lows will usually get reactions in both directions. These are emotional price areas and price reactions should be expected. What we want to assess are indications of price showing signs of failure, usually in the form of large, very swift moves to the downside as price takes many market participants by surprise and losses mount quickly with buyers and short sellers entering the move. Conversely, signs of a successful test are outlined at the end of this article.
Learning skills, techniques and tools for this task can help traders identify when markets are merely testing or there may be more serious warning signs underneath the surface.
Chart 4 below shows a current section of a Daily NASDAQ chart showing recent 1.27 extension patterns and a projection of another potential 1.27 extension pattern around the 11402 area. This pattern is covered in the book Trade What You See, How to Profit From Pattern Recognition, written by myself and Larry Pesavento.
Note the RSI shown on the lower section of this chart. The red down-sloping line is indicating negative divergence; as price moved higher, RSI was unable to move to higher levels.
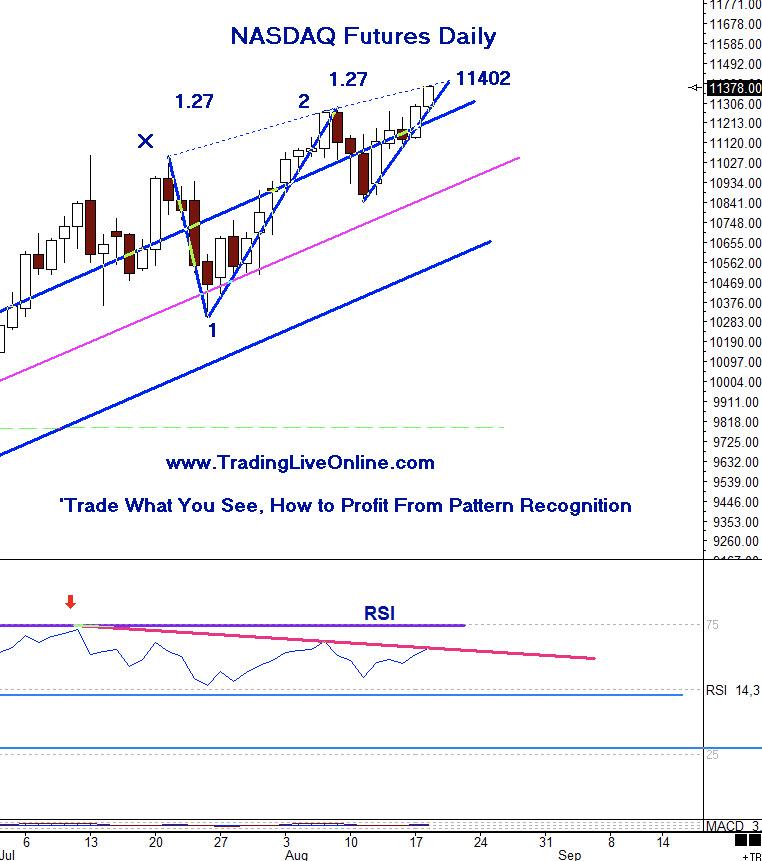 Chart 4 - NASDAQ Daily with 1.27 Extension Pattern
Chart 5 below is a 60-minute intraday NASDAQ showing the index nearing the 1.27 extension level of 14402 and backing off.
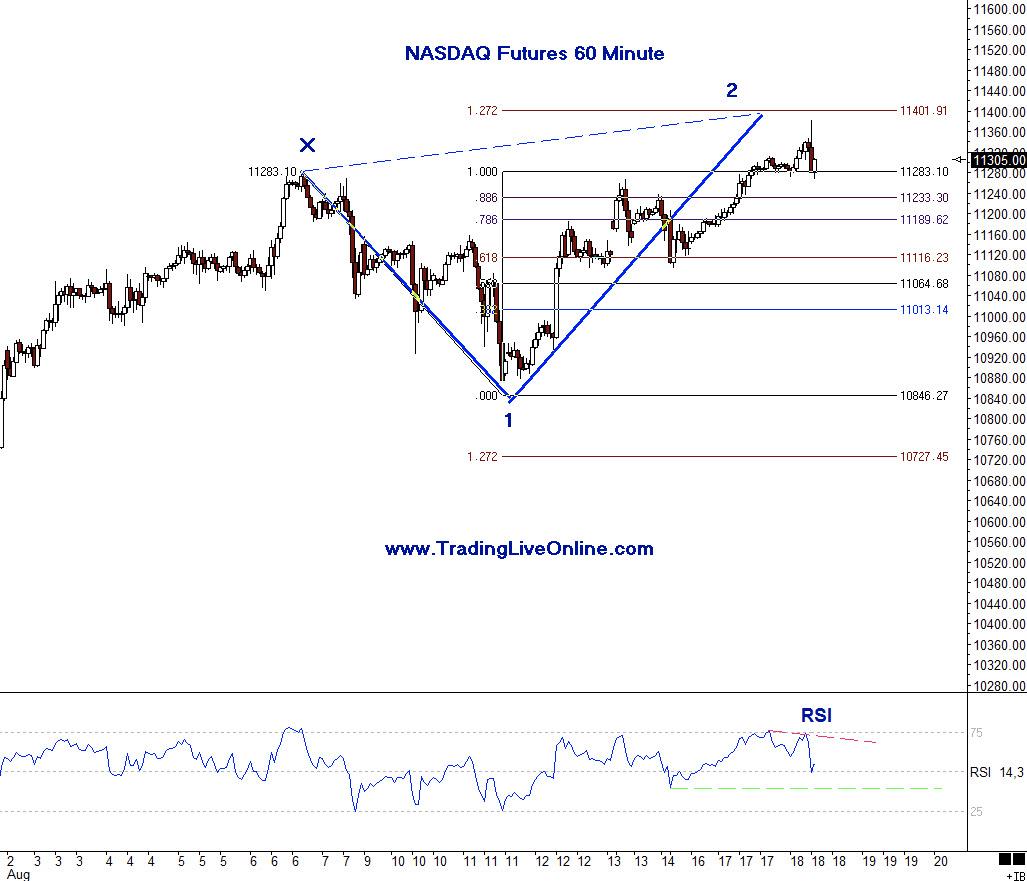 Chart 5 - NASDAQ Intraday 60 Minute 1.27 Extension
Chart 6 and 7 show the S&P 500 eMini on a Daily and Intraday 120-minute chart, as this index is testing the all-time highs of 3396.50 and the current position of the RSI also showing negative divergences.
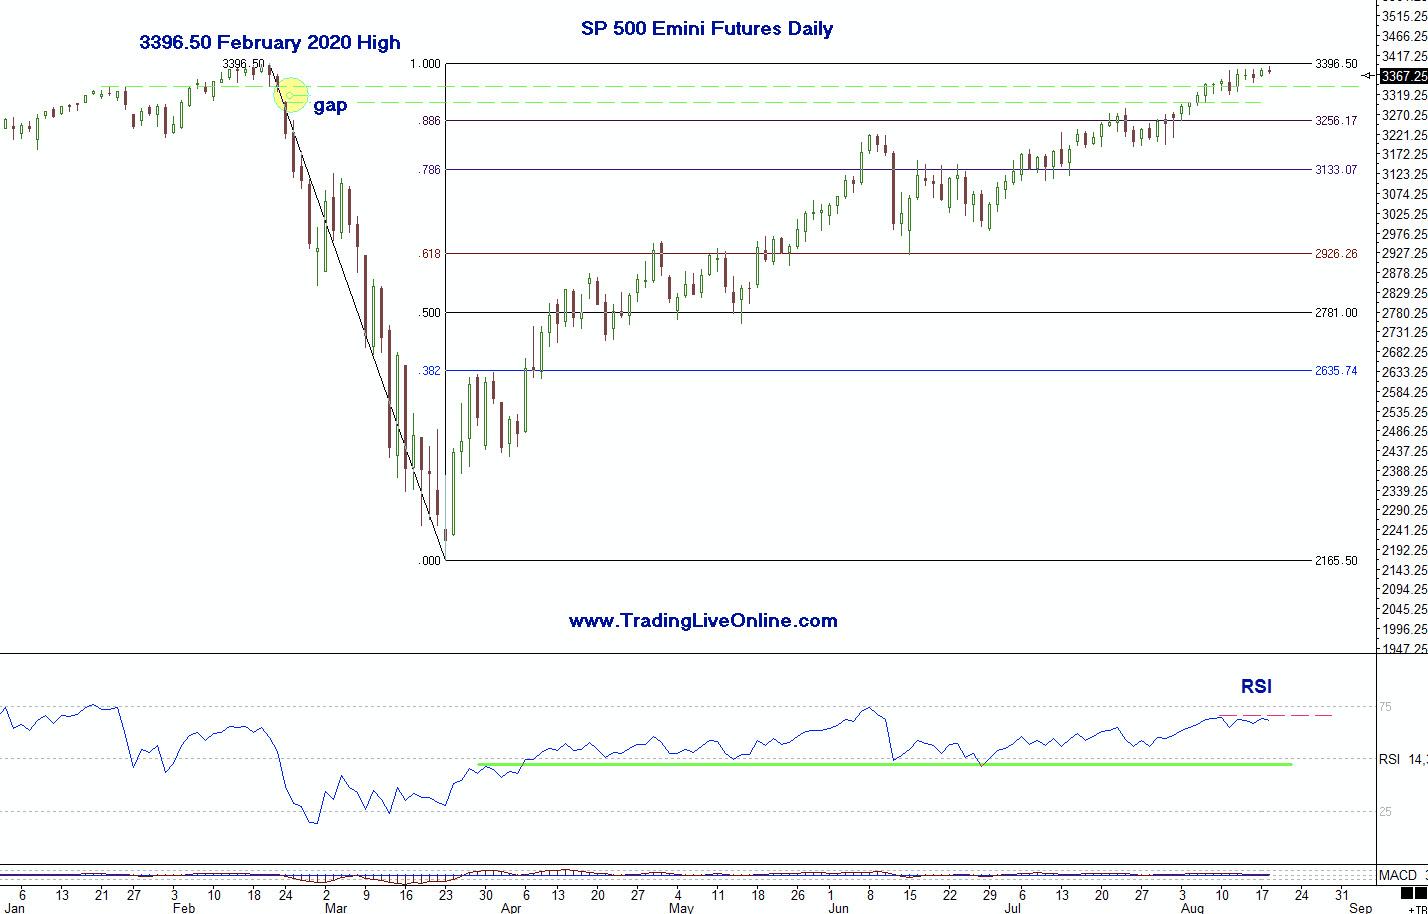 Chart 6 - S&P 500 eMini Daily
The green horizontal RSI support line will be an important area to watch if price declines.
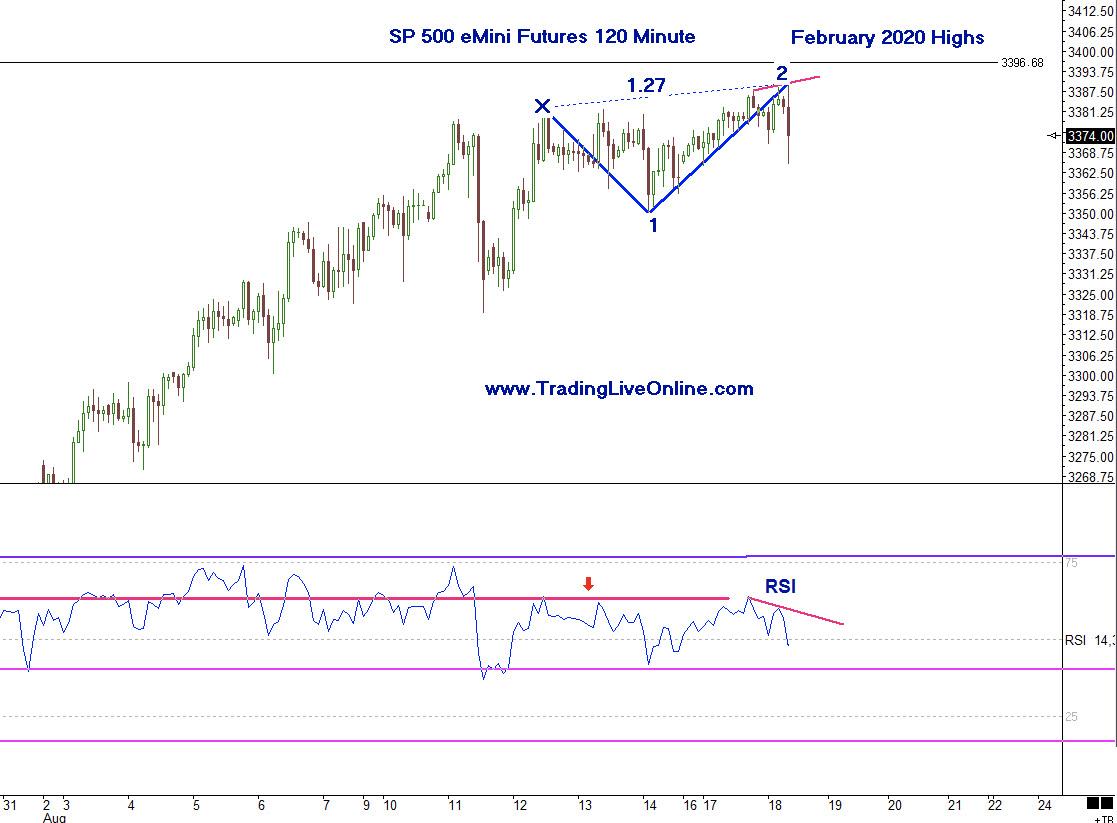 Chart 7 - S&P 500 Emini Intraday 120-minute
We can see price reaction as it completed the intraday 1.27 extension pattern and came close to the all-time highs. Price may consolidate in this area and then try for all-time highs, or we may see a failure as described above.
The last chart is the $INDU on a daily chart showing it is still lagging the NASDAQ and the S&P 500 eMini.
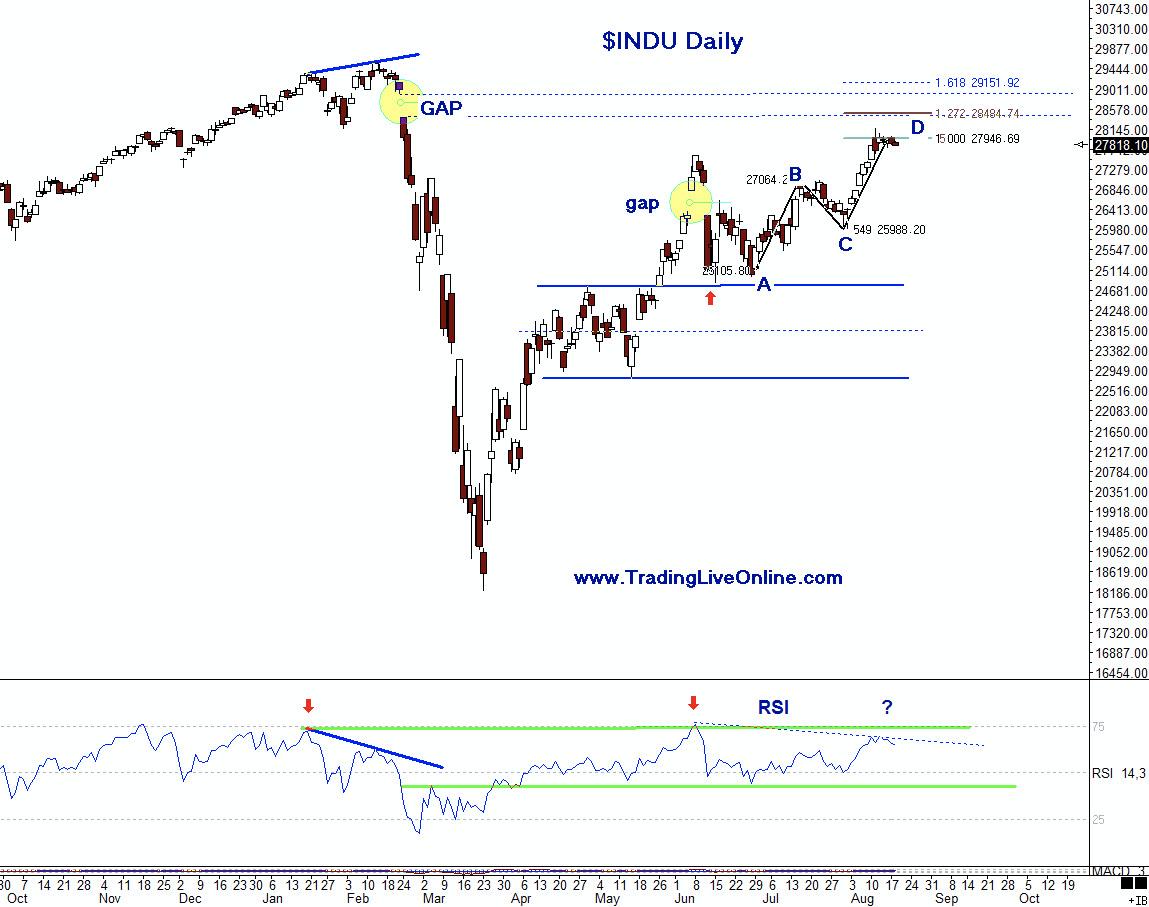 Chart 8 - $INDU Daily
The $INDU is at important price resistance. It also has formed an AB=CD/Butterfly sell pattern that has completion price levels at areas around the gap from February 2020. The RSI may have negative divergences here, as marked on the lower section of the chart.
Negative divergences can sometimes work themselves off with sideways price movement, possibly creating a range before the previous price move resumes. Monitoring price reactions with the indexes at or very near new highs, or into important gap resistance such as the $INDU, is important.
If there is a successful move to new highs by the S&P 500 and $INDU, we should see strong closes above the previous high, potentially some testing slightly back into the previous high and gap areas, then resumption of the trend. As mentioned, a strong swift move down, breaking support areas, will likely be the indication of price failure.
It's always important to learn entry skills, which include combining elements of intraday timeframes, momentum indicators and other price patterns to control risk and also, at times waiting on the sideline until there is confirmation.
There are specific patterns and trading techniques that can be learned and implemented to control risk and monitor the price behavior. We never know what price will do; the only element we can control is the risk.
My Self-Study Course will educate traders and build trading skills.
If you would like to learn more about these patterns and programs in order to learn how to trade them, please visit me at my website www.tradingliveonline.com, or feel free to email me at ljouflas@msn.com.
Best wishes for successful trading!
Leslie Jouflas, CMT