
Back on June 4, I wrote about how "Non-Divergences Are Better Than Divergences" in terms of seeing confirmation that there is more trending movement ahead. Analysts get excited about marking the turning points for prices, but trends are where the money gets made. So if you can get a message to not let go of a strong trend - and to not get shaken out on suspected trend change signals - that is a wondrous message to receive.
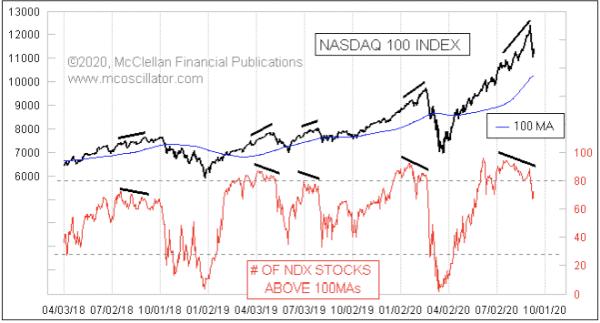
In that article, I shared the indicator which is featured again in this week's chart. It counts the number of stocks in the Nasdaq 100 Index that are above their own 100-day moving averages. Back in June 2020, it was still making higher highs (i.e. no divergence) and thus was saying that the market was likely NOT at an important price high. A minor pullback was still possible at any time, but the uptrend should be considered as NOT over.
That was a good message, and the price uptrend continued all the way to the September 2 top. Along the way, a divergence developed between prices making a higher high but this indicator making lower highs. This was an important topic discussed in our Daily Edition, where the value for this indicator gets reported every day. That divergence said that trouble was brewing, although that message is only about a condition - it is not a "signal" to tell us when that condition will matter. But it is still a nice condition to know about.
The drop from that Sep. 2 top has given us the fulfillment of the big warning from the divergence. Okay, so what's next? History shows us that a meaningful drop out of such a divergence does not end after just a 3-day drop. Usually, it lasts until this indicator gets down close to the 30-oversold level, or even below it. In either case, the implication for the moment right now is that there is still more work to do.