
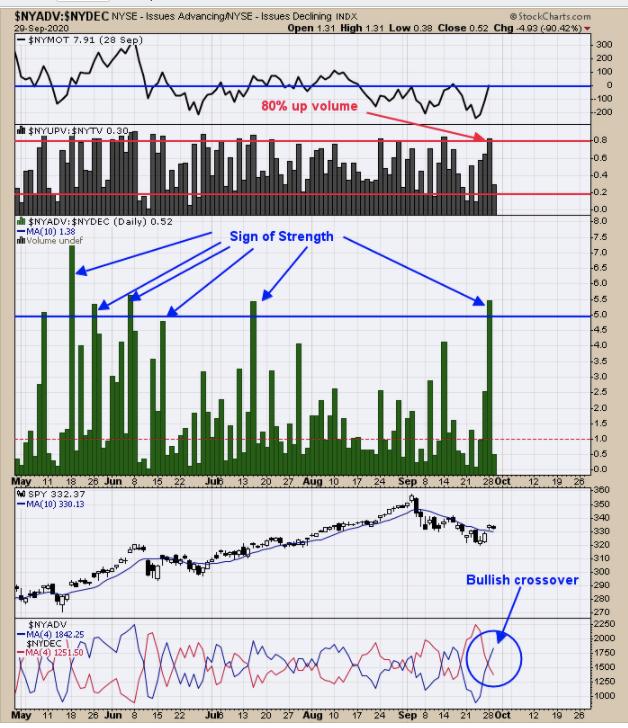
We have updated this chart from yesterday. Back then, we said, "Now we have a 'Sign of Strength' day (above chart) where up volume compared to total volume stands at 80% and Advancing issues compared to declining issues is over 5/1. The bottom window is the 4-day average of the Advancing issues (blue) and 4-day average of declining issues (red) which had a bullish crossover today." Notice that the bullish crossover of the 4-MA of Advancing issues and 4-MA of Declining issues extended more into the bullish phase. The picture remains bullish short term.
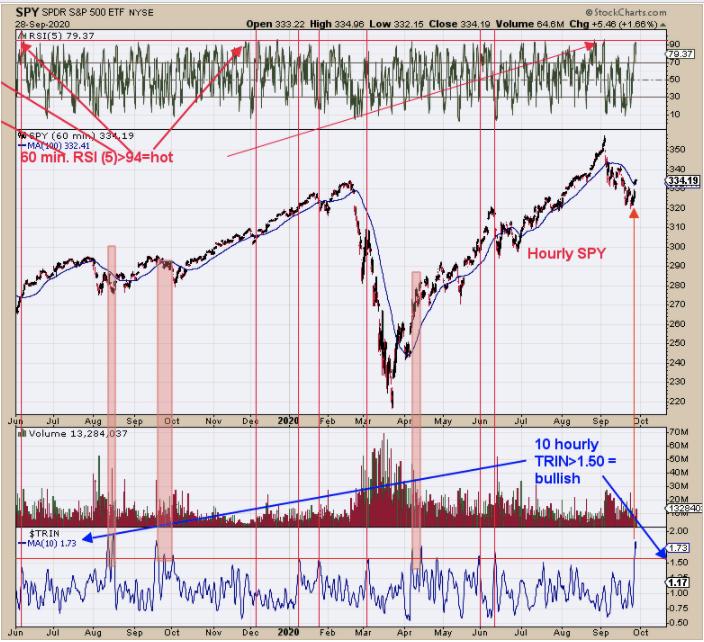
The above chart is on the hourly timeframe. The bottom window is the 10 hourly average for the TRIN. 10 hourly TRIN above 1.50 have been a bullish sign for the SPX; today's close came in at 1.73. Readings this high suggests there is panic in the market and a bullish short-term sign. Possible short-term target is the previous high on the SPY, which is near the 342 range (3425 SPX).
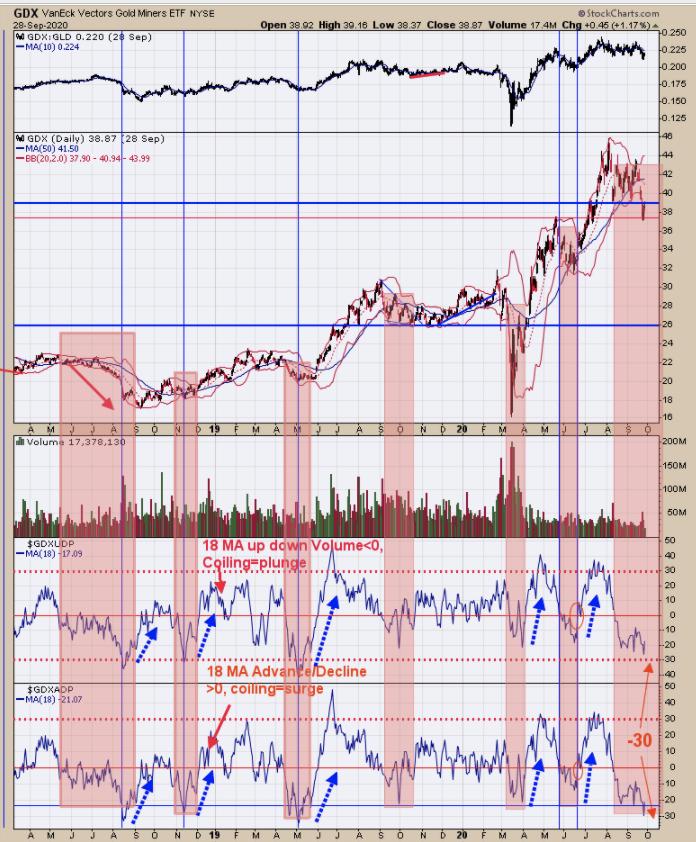
The bottom window is the 18-day average of the Advance/Decline Percent (GDXADP) and the next window higher is the 18-day average of the Up Down Volume percent (GDXUDP). When both are below "0" (like now) the market is in a consolidation phase (identified in shaded areas). A further decline in GDX and pushing both indicators below -30 will suggests an exhaustion move to the downside, where a bottom would form (identified with blue vertical lines). If both indicators don't reach -30 but start to head up, that would also be a bullish short term sign (blue dotted arrows). So far, neither one has developed. GDX is at a support, which is the previous high. It would appear one of these scenario will be triggered soon. Seasonality is bearish for now and, if a signal is triggered, would suggests a short term trade that may last a week or two. Staying neutral for now.
Tim Ord,
Editor
www.ord-oracle.com. New Book release "The Secret Science of Price and Volume" by Timothy Ord, buy at www.Amazon.com.