
SPX Monitoring Purposes: Neutral.
Monitoring Purposes GOLD: Long GDX on 10/9/20 at 40.78.
Long Term SPX Monitor Purposes: Sold long SPX on 1/15/21 at 3768.25= gain 10.80%; Long SPX on 10/26/20 at 3400.97.
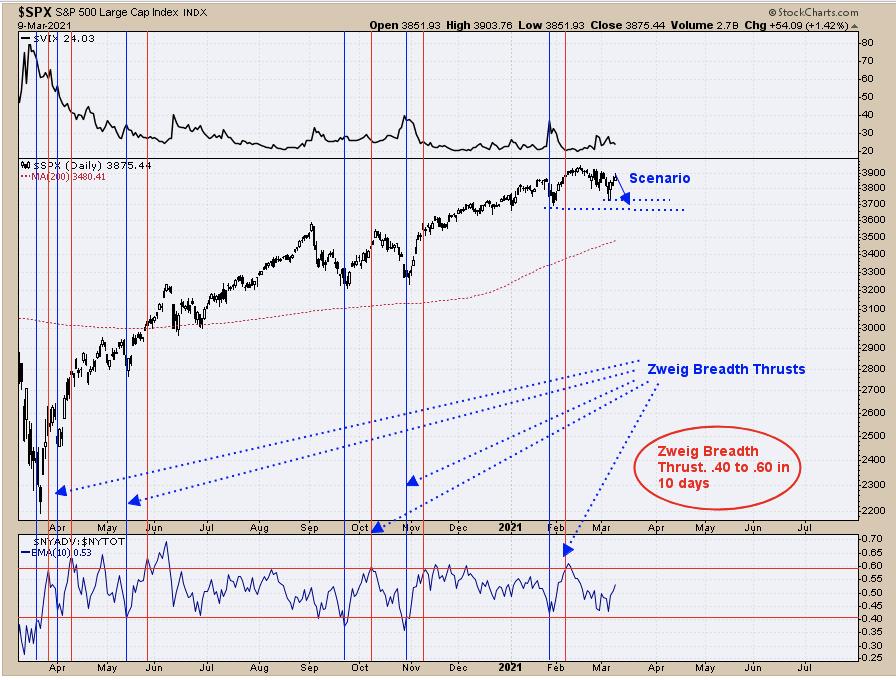
The above chart is updated on today's data. We said yesterday, "Above is the 'Zweig Breadth Thrust' which shows up in markets that are strong and usually doesn't show up near intermediate-term market highs. There can be short-term highs and retracements, but intermediate-term highs are not expected. There was a Zweig Breadth Thrust in late February. The worst that can be expected is a test of the late February low, which came in near the 370 SPY range. Also, there was a lot of high TRIN closes between 370 to 380 SPY levels, which also suggests support. For now, the intermediate term looks okay, but nothing works 100% of the time." With today's light volume rally to new short-term highs without high TRIN closes at last week's low, the possibility to test last week's low is still on the table (though this time could be different).
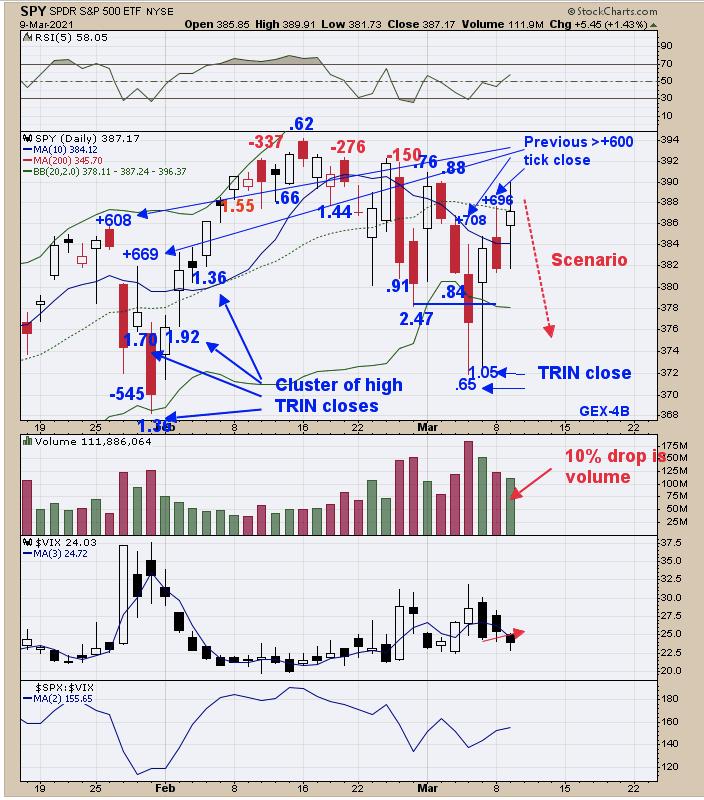
Yesterday, we said, "on Friday, the TICK closed at +708 and today +696; the last time the TICK closed near these levels came on 1/26 and 1/28 when both where at short-term highs. It is said, 'if a market can't take out the previous high with volume, it will reverse and attempt to take out the previous low.'" The previous low is last Thursday's low, which is 372 SPY range. Today's volume was lower than Friday's volume, showing there was no energy to push higher. The conclusion is that we may see a short-term pullback to test last week's low. For a bullish setup, we will look for TRIN readings above 1.3 and TICK closes below -200. That may show up on a test of last week's low." Today the market pushed higher, but closed below yesterday's high and volume dropped 10% compared to the day before, which is a bearish sign. The last Thursday and Friday's TRIN close (last week low days) came in at .66 and 1.05, which is not at panic levels; most bottoms form on panic. Not sure the low is in. Will wait for a better setup, will remain neutral for now.
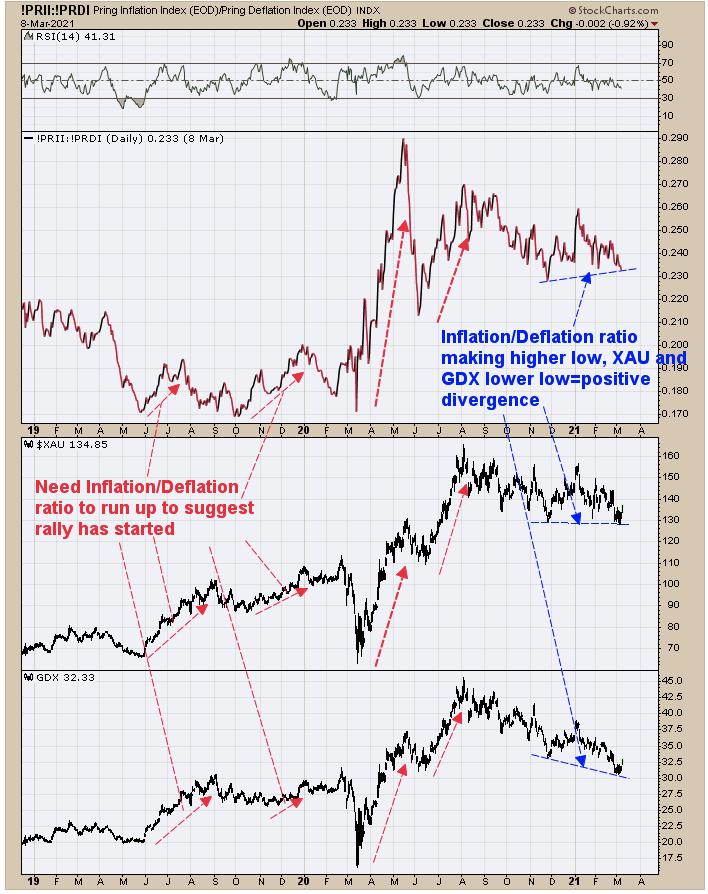
Above is a short term view for the XAU and GDX. To suggest a rally has started in GDX and XAU, the Inflation/Deflation ratio needs to start trending higher. We pointed out with red arrows what happened in the past during GDX and XAU rallies; the Inflation/Deflation ratio trends higher. There is a positive divergence where the Inflation/Deflation ratio has made higher lows while GDX and XAU made lower lows. As of yesterday's close, the Inflation/Deflation ratio has not turned up, but, with the positive divergence, it may do so shortly. Also, GDX is at a long term support line that dates back to 2013 and unlikely to be broken (though it could see tests). Long GDX (10/9/20 at 40.78).
Tim Ord,
Editor
www.ord-oracle.com. New Book release "The Secret Science of Price and Volume" by Timothy Ord, buy at www.Amazon.com.