
SPX Monitoring Purposes: Sold long 4/9/21 SPX at 4128.80= gain 6.16%; Long SPX on 3/24/21 at 3889.14.
Monitoring Purposes GOLD: Long GDX on 10/9/20 at 40.78.
Long Term SPX Monitor Purposes: sold long SPX on 1/15/21 at 3768.25= gain 10.80%; Long SPX on 10/26/20 at 3400.97.
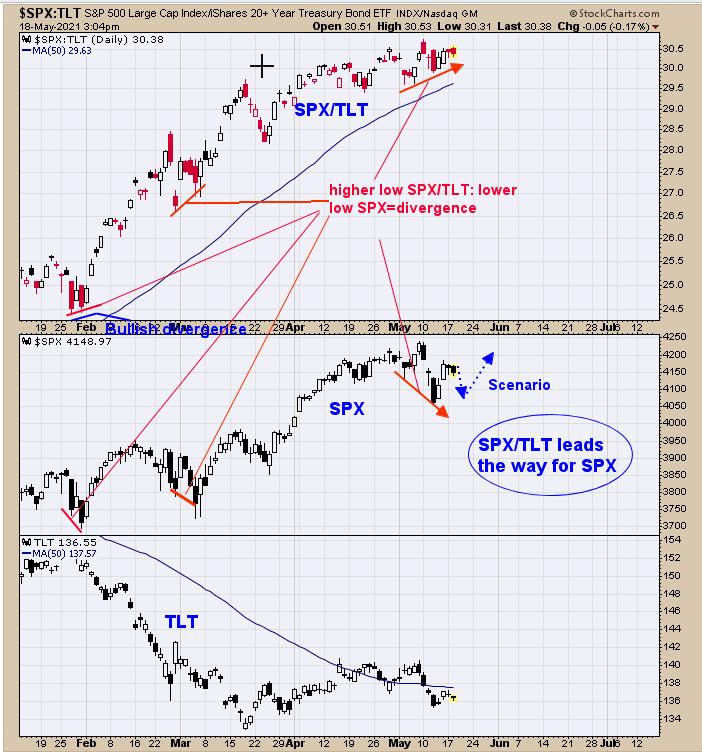
We updated this chart again from yesterday's close. Last Thursday, we said "The top window is the SPX/TLT ratio, which rises and falls with the SPX. Where there is a divergence between the SPX/TLT and SPX, a reversal in the SPX is near. A divergence is present now, as the SPX/TLT has made higher lows as SPX has made lower lows. Would like to see more panic in the TICK and TRIN short-term to set up the bullish signal." All or most all bottoms produce panic readings in the TICK and TRIN. On today's pullback, the TRIN did close at 1.53, suggesting a low is not far off. Our view short term is for the market to have a modest pullback.
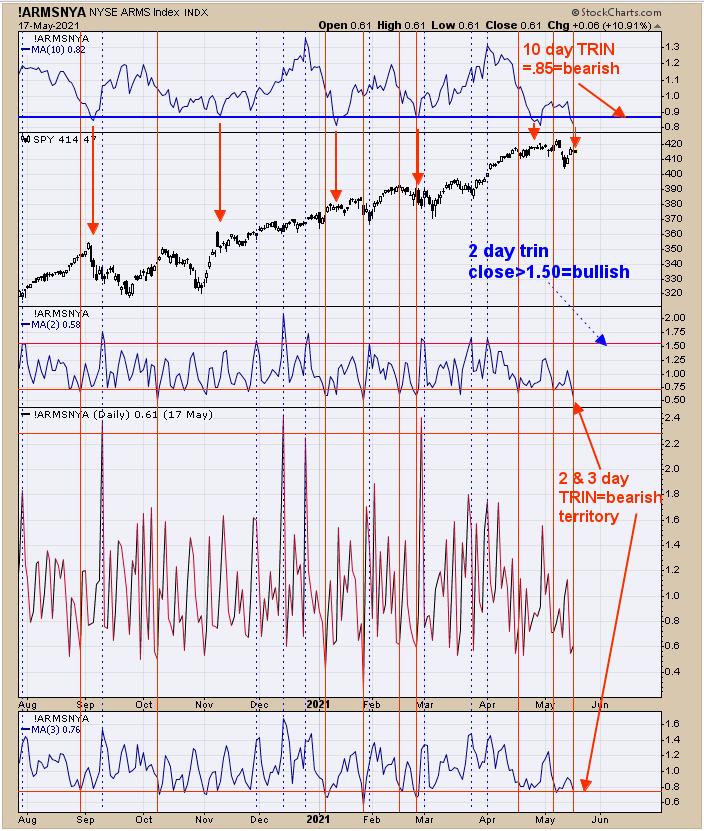
The top window is the 10 day average of the TRIN; readings near .85 and lower appear near short term high, and yesterday's close is .82. The bottom window is the 3-day average of the TRIN; readings near .75 are a bearish sign for the market, and yesterday's reading was .76. The window below the SPY chart is the 2-day average of the TRIN; readings below .75 are a bearish sign, and yesterday's close was .58. Its rare to have all three TRIN averages near bearish levels. Previous examples like this lead to a sideways or down market short-term. Today's TRIN close came in at 1.53 and in panic levels, starting to change yesterday's average TRIN readings towards the bullish levels. With today's TRIN close of 1.53, signs for a bottom are starting to appear.
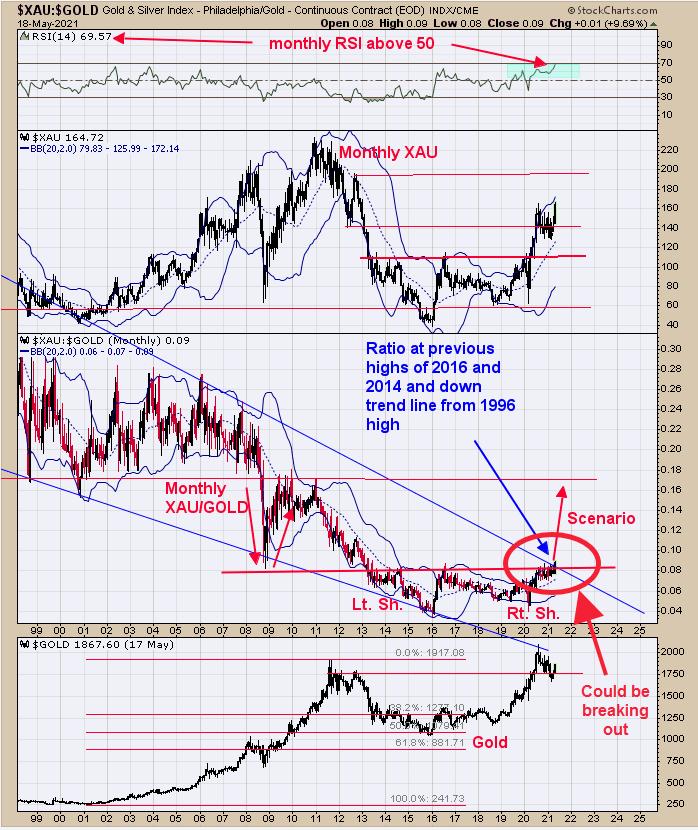
The best may be yet to come. Above is the monthly XAU/Gold ratio dating back to 1999. This ratio is at the previous highs of 2016 and 2014 and the downtrend line connecting the highs going back to 1996. It appears a "breakout" is about to happen and a surge in price for this ratio. This ratio has been in a tight trading range for nearly a year and has been modestly rising the last 6 months. The tight trading range suggests an impulse wave is coming and the modest rise suggests the impulse wave will be up. Also notice that the ratio's tight range is not backing away of the trend line dating back to 2014, which implies it's absorbing supply and, once supply is exhausted, it will rally higher. Could see a large jump in price for this ratio in the coming weeks. A large jump in this ratio suggests a large jump in XAU, along with a jump in GDX and HUI. Notice also the monthly mid-Bollinger band is now rising, suggesting the longer-term trend is up for this ratio. Long GDX (10/9/20 at 40.78).
Tim Ord,
Editor
www.ord-oracle.com. New Book release "The Secret Science of Price and Volume" by Timothy Ord, buy at www.Amazon.com.