
SPX Monitoring Purposes: Long SPX 6/28/21 at 4290.61.
Monitoring Purposes GOLD: Long GDX on 10/9/20 at 40.78.
Long-Term SPX Monitor Purposes: Neutral
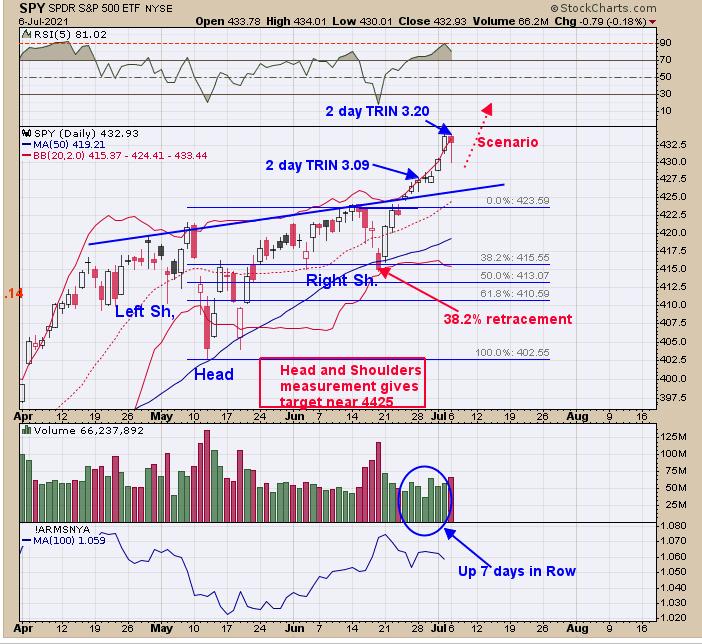
Today, the two-day TRIN closed yesterday at 3.20, a bullish sign. Two-day TRIN that add up to over 3.00 have been a buy signal for the market, but can be early by two days. Support now lies near the previous high of the 425 range. The pattern that appears to be forming is a head-and-shoulder bottom where the double head came at the mid-May lows. This potential head-and-shoulders bottom has a measured target near 4425 on the SPX. We also noticed that the pullback to the June 18 was only a 38.2% retracement of the previous rally, showing the market is in a strong position. Friday marked seven days up in a row and suggests the market will be higher within five days 94% of the time. Could see short term minor pull back, but higher highs are coming.
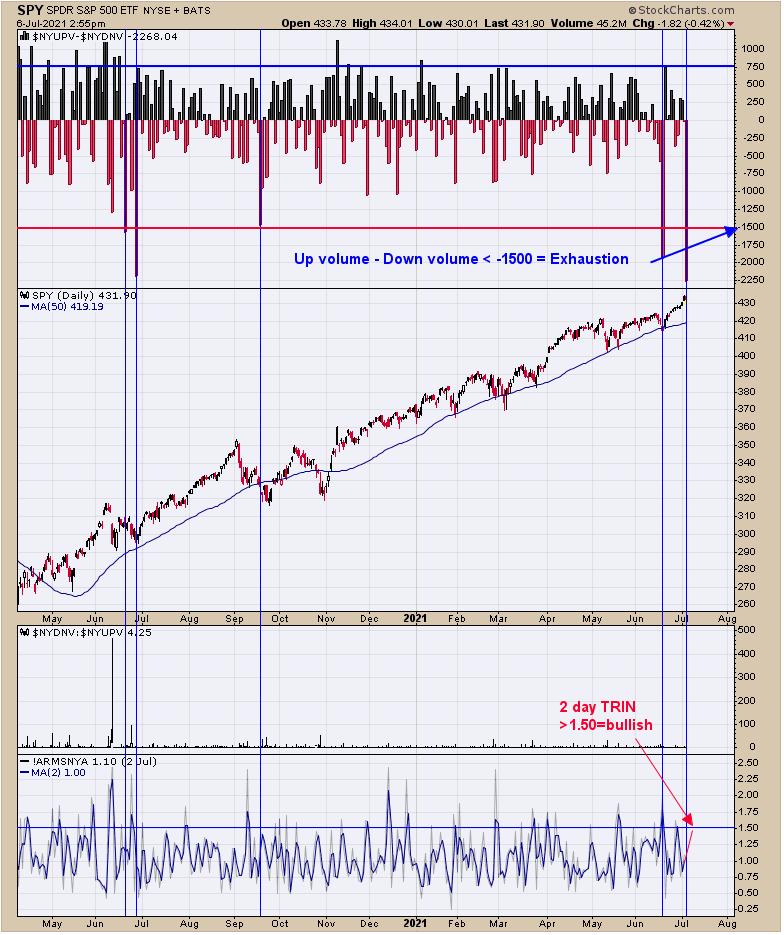
Everyone head to the exits. The above chart is the NYSE UP Volume – NYSE Down Volume. When this relationship reaches below -1500 (current reading is -2268), the market is not far from a bottom. The bottom window is the two-day average of the TRIN and, when it reaches near 1.50 and higher (current reading is 1.60), panic in the market is implied and that is what bottoms are made of. Seasonality-wise. things are favorable into the third week of July. When indicators flash panic readings right after a high day, that is when markets are usually not forming a high but rather building energy to move higher. Trend is still up.
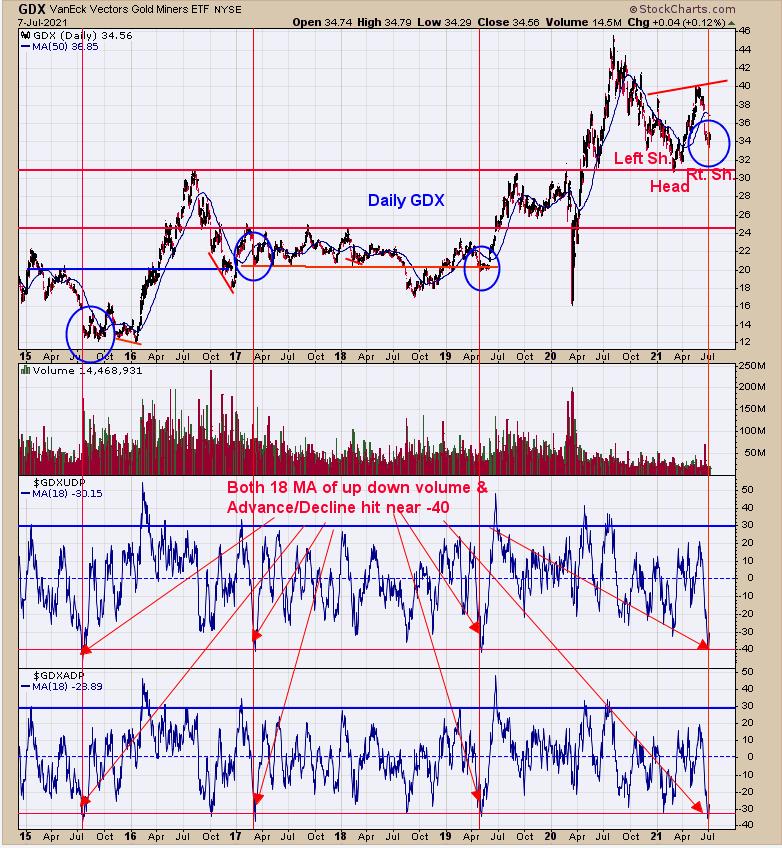
We updated this chart from last Thursday, when we said, "the bottom window is the Advance/Decline percent and the next window up is the Up Down volume percent. A low in GDX can be expected when both indicators reach below -30. We moved the lower line on both indicators to where the current readings bottom out. Those lower current reading were matched to what happened previous times when readings got this low. There were three matches to the current low reading (going back to 2015), which is identified with red vertical lines. Three matches in 6 years is a rare event and all three marked worthwhile lows. There was also a "Selling Climax" on June 17, which adds to the bullish setup. The pattern that appears to be forming is a head-and-shoulders bottom, where the March low was the head. This potential head-and-shoulders bottom has a measured target near 50.00, which would put it to a new high." The low on GDX came on 6/29/21 and both the Up Down volume and Advance/Decline indicators have moved higher since then, suggesting that may have been the bottom.
Tim Ord,
Editor
www.ord-oracle.com. New Book release "The Secret Science of Price and Volume" by Timothy Ord, buy at www.Amazon.com.