
SPX Monitoring Purposes: Sold long 8/9/21 at 4432.35=gain .466%; long 7/23/21 SPX 4411.79
Monitoring Purposes GOLD: Long GDX on 10/9/20 at 40.78.
Long Term SPX Monitor Purposes: Neutral
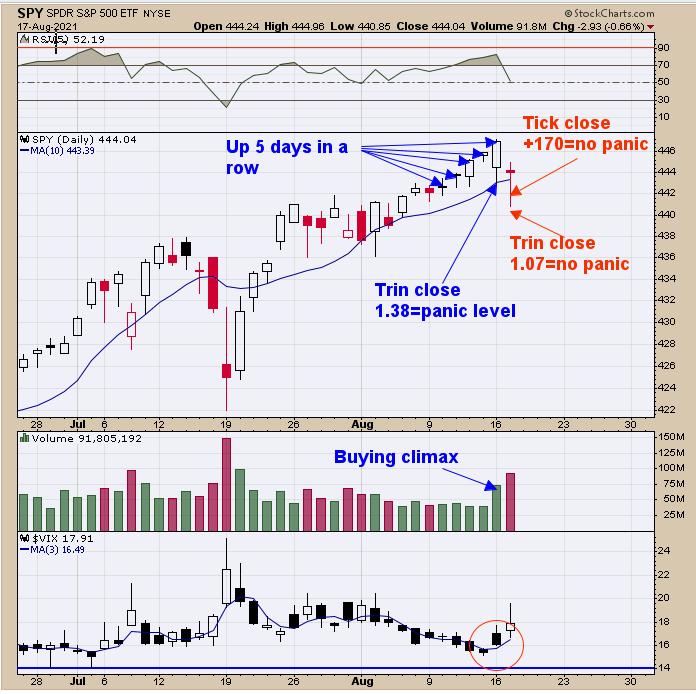
Yesterday, we said "The strongest week seasonality-wise for the next four weeks is this week. This week is also options expiration week, which has a bullish bias. Today marked the fifth day up in a row. This scenario points to the conclusion market will be higher within five days 85% of the time and the average gain is 0.8%." The 5-day up thing keeps the trend up. Bottoms form on Panic and we use the TICK and TRIN readings to help define panic. What we are looking for now is panic readings in the TRIN and TICK. Yesterday, the TRIN closed at 1.38, which is showing panic. If the TICK closed below .300 today, we would have issued a bullish signal; however, it closed at +170, which is not showing panic. What it appears short-term is that there is not enough panic in the market to get a rally going; a panic may develop short-term to finish the bottom process.
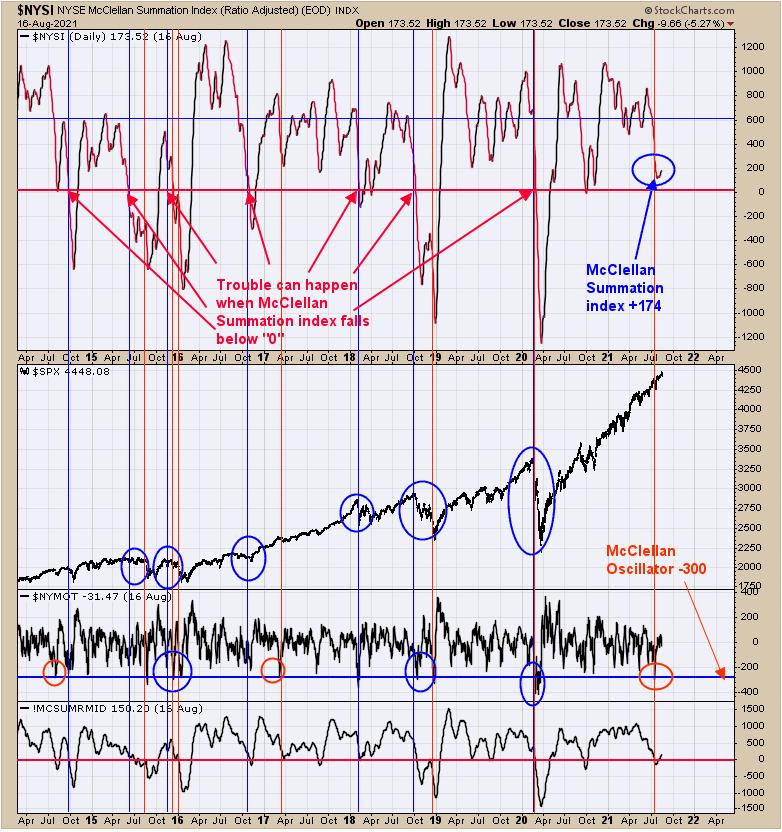
We updated this chart from yesterday. The above chart is NYSE McClellan Summation index (which you have seen before) showing the NYSE McClellan Summation index (Monday's close) at +174. Large declines can occur when the Summation index drops below "0"; market is not setup for a large decline here because the Summation index is far above 0.
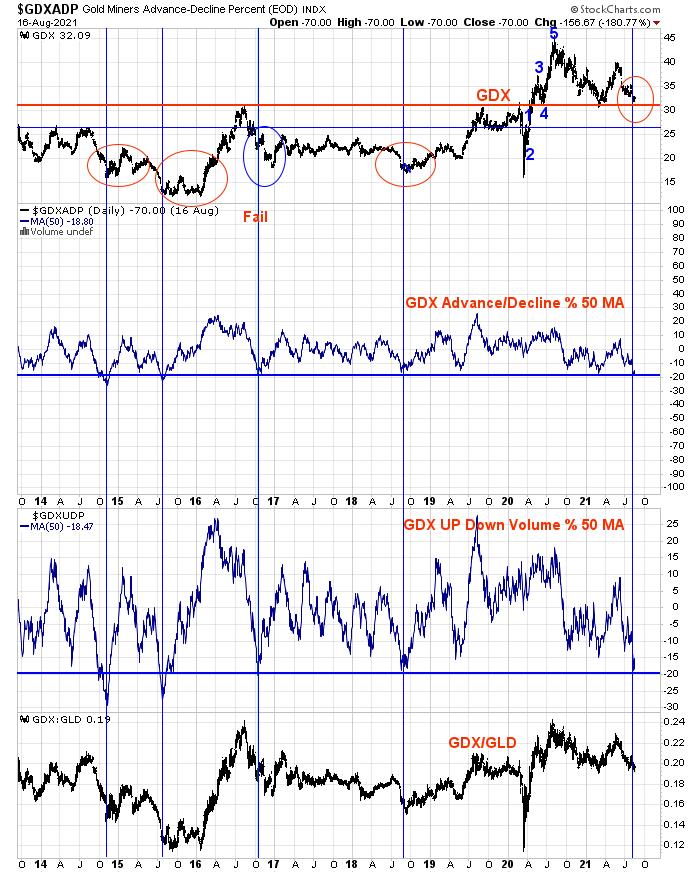
Yesterday, we looked at the 18 moving average of the Advance/Decline percent for GDX and the 18 moving average of the Up Down Volume percent for GDX. Above is the 50-day average for both indicators, which take in a longer-term time span. We marked with blue vertical lines the times when both indicators reached below -20. It would seem that, when both the 18- and 50-day moving averages of both indicators reach bullish levels, the odds are high for some type of rally to begin. Momentum rules all indicators; the monthly timeframe rules the weekly and the weekly rules the daily. The monthly mid Bollinger Band for GDX is rising, suggesting the monthly trend is up. It appears to be more of a waiting game before the rally gets going.
Tim Ord,
Editor
www.ord-oracle.com. New Book release "The Secret Science of Price and Volume" by Timothy Ord, buy at www.Amazon.com.