
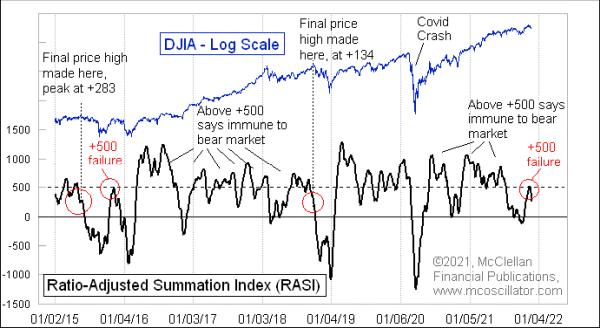
The NYSE's Ratio-Adjusted Summation Index (RASI) has just had a failure at the +500 level, and that spells trouble for the uptrend.
When the RASI is able to climb up above +500, it offers some degree of immunity to the stock market from the worst sorts of declines. An ordinary correction can come along anytime, and can even take the RASI down well below +500 or even below zero -- that's not a problem. The problem arises when the RASI is unable to get back up to above +500 after such a correction.
That is what we are seeing now. The message is that the new up move has failed to achieve "escape velocity", like a rocket not going fast enough to get away from a planet's gravitational pull.
The +500 level can also show significance in another way. If the price indices keep making higher highs but the RASI turns down and falls below +500, that can be a real problem. There are a couple of examples highlighted in the chart above when the DJIA made its final price highs for a move with the RASI below +500 and falling.
When the RASI can climb up well above +500, that is a bullish indication, but it is not infallible. The COVID Crash in March 2020 provided us an example of how when a large exogenous force comes over the market, it can trump other, more bullish messages. The 9/11 attacks in 2001 would be another example.
There are very few examples, though, of seeing the bearishness of a +500 failure and having an uptrend continue on. Here is a flashback chart from several years ago to help illustrate this point.
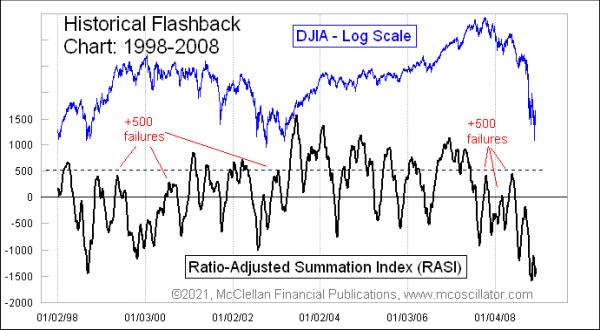
In late 1998, the market started upward out of an oversold bottom and the RASI failed to get up above +500. The large-cap averages, like the DJIA and especially the Nasdaq indices, were able to keep pushing to higher highs. But most stocks did not join in that advance.
This chart also shows us several other examples of +500 failures and the bearish price action which followed in the immediate aftermath. The bull market that ended in October 2007 did so on a +500 failure; there were several more such failures during the countertrend rallies in 2008, each one telling us that the bulls could make brief counterattacks but could not get their act together to take charge. Finally, in April 2009, which is off the right side of this flashback chart, the RASI was able to rise well above +500 to tell us that a new bull market had begun.
The existence of the current RASI +500 failure in the top chart does not tell us by itself how bad things might get, nor how long the unpleasantness may last. It is just saying that, right now, the bulls do not have their act together, and we should expect the rocket to fall back to earth in the weeks to come.