
SPX Monitoring Purposes: Long SPX 11/30/21 at 4566.97.
Monitoring Purposes GOLD: Long GDX on 10/9/20 at 40.78.
Long Term SPX Monitor Purposes: Neutral
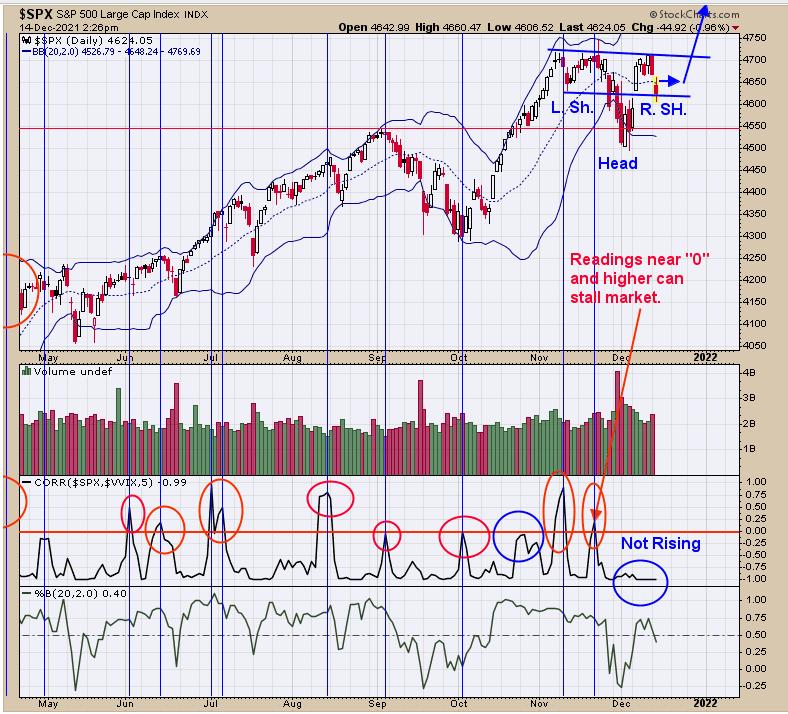
Yesterday, we said, "The second window up from the bottom is the correlation of SPX to VVIX. When this indicator reaches .00 or higher, the market can stall (noted with blue vertical lines). When this ratio stays around the 1.00 range, then a pullback to any large degree is unlikely. Since this indicator is near 1.00 and not rising, this suggests the market may just move sideways short term. It may be waiting for the FOMC meeting announcement, which is Wednesday, and could move sideways into that timeframe." To add to the above, the pattern forming appears to be a head-and-shoulders bottom, and the Right Shoulder may be forming now (see chart above). We are long SPX on 11/30/21 at 4566.97.
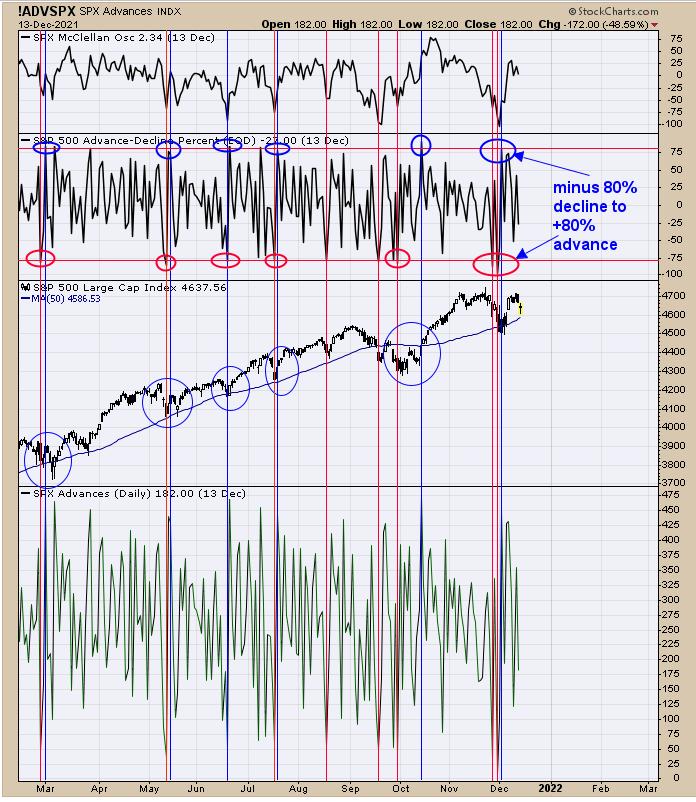
The second window down from the top is the SPX Advancing – Declining issues. When this A/D line reaches -80% (oversold) and then rallies to +80% in the short-term, that suggests an initiation of an up move. The red circle on the chart above shows the times the A/D line reached -80% readings and the blue circle shows the +80 readings. Going into the December low, the A/D line did reach -80% twice and the rally out of that low did reach +80%, suggesting an initiation of an up move and that the rally has further to go. We do have Thursday and Friday of this week being higher, so the FOMC announcement could be the turnaround day. Lots of down tick on the close today (-724) and usually a bullish sign short-term.
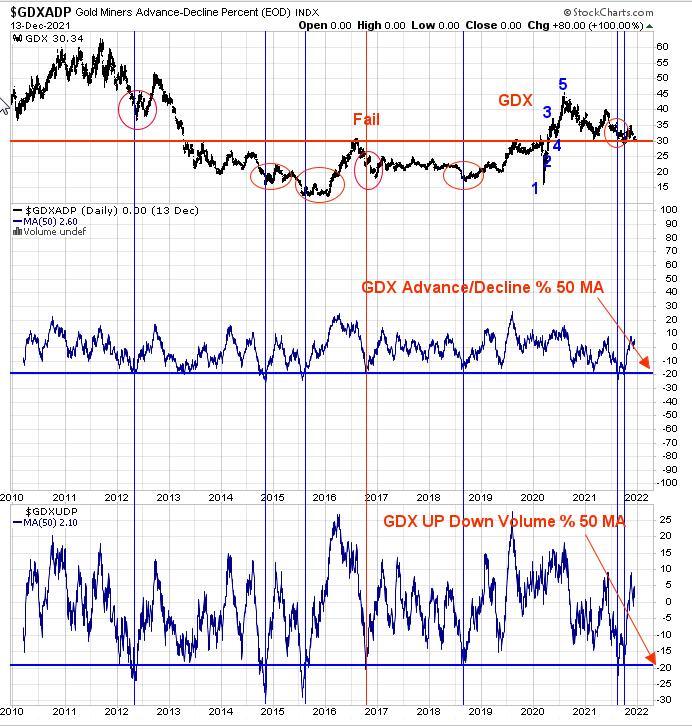
Yesterday, we showed the 18-day average of the Advance/Decline percent for GDX and the 18-day average of the Up Down volume percent for GDX. Both indicators reached below -35 last Friday, showing short-term exhaustion and a bullish sign. Above are the 50-day average of the Up Down volume (bottom window) and the 50-day average of the Advance/Decline (next window up). The 50-day average looks at the bigger picture and, as you can see, both 50-day indicators reached bullish levels in August and September of this year, suggesting an intermediate-term bullish signal has generated. Now we have the shorter-term indicators lining up with the intermediate-term indicators on the bullish side of the ledger.
Tim Ord,
Editor
www.ord-oracle.com. New Book release "The Secret Science of Price and Volume" by Timothy Ord, buy at www.Amazon.com.