
A bullish signal is bullish, except when it's not.
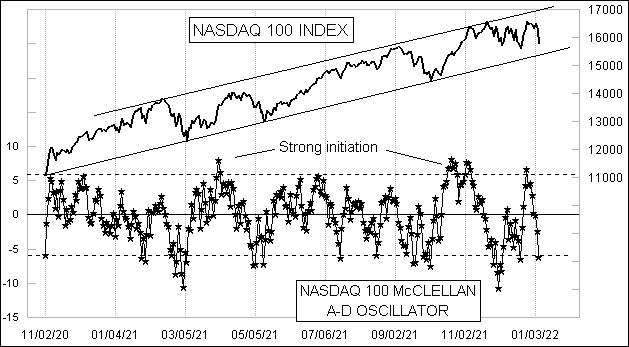
This week's chart looks at a McClellan A-D Oscillator, calculated using advances and declines for the stocks which make up the Nasdaq 100 Index. Because it has fewer issues than the overall NYSE or Nasdaq markets, the numerical values for this McClellan Oscillator are necessarily going to be lower. That is why looking at a chart is essential to make sense of any day's particular reading.
When this McClellan A-D Oscillator gets up to above around +6, it shows an overbought condition, but one which can also signal strong initiation of a new uptrend. That message of initiation gets confirmed when we see some "complexity" in the Oscillator postings above zero. A complex structure is one that has up and down chopping without going across the zero line. Such a structure implies strength for the side of zero on which it forms, either bullish strength or bearish strength.
On Dec. 27, 2021, this Oscillator rose up to +6.6, possibly signaling more strength to come, but also showing an overbought condition. That message of possible strength to come was not fulfilled, as this Oscillator just turned around and headed down through zero. It did not build any complexity above zero. The message of such behavior is that the pop was just a countertrend rally and that the bears really are the ones in charge at the moment.
The drop has taken this McClellan A-D Oscillator all the way down to an oversold reading, which, in an uptrend, should be enough to halt the decline. But in a downtrend, the market can ignore oversold readings and keep on trending lower. Indeed, these are ways that you can know you are in a downtrend, when you see bullish signals not leading to more upside and when oversold readings fail to stop a decline.