
SPX Monitoring Purposes: Short SPX 1/11/22 at 4713.07.
Monitoring Purposes GOLD: Long GDX on 10/9/20 at 40.78.
Long Term SPX Monitor Purposes: Neutral.
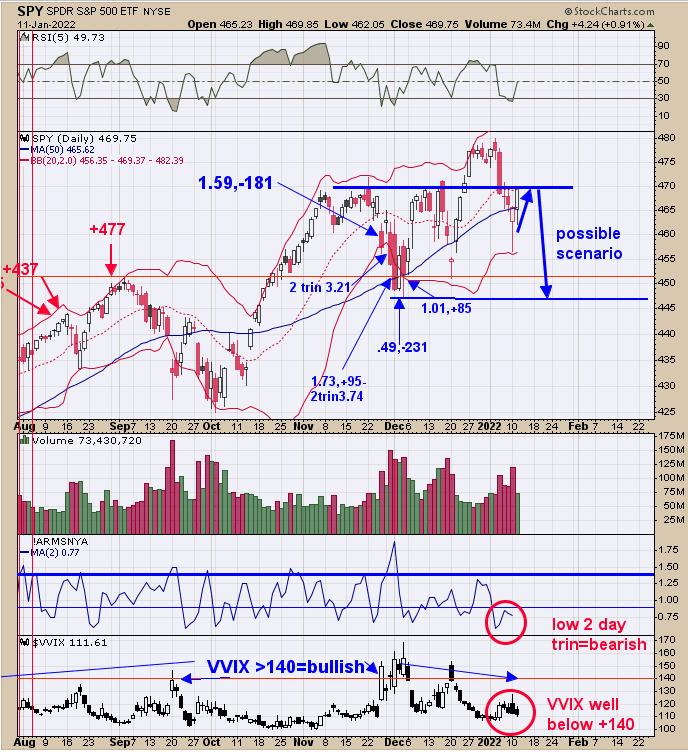
Yesterday marked five days in a row down on the SPX; five down days in a row predicts that market will be lower within five days 87% of the time. Also, 2% declines usually come in clusters, and last week's decline was over 2%. Resistance lies near 470 on the SPY, which was reached today. Neither the TRIN nor the TICK reached panic levels over the last several days' decline, suggesting no worthwhile low has formed yet. Tops can take time to form and, therefore, today's high may not be the final high, but may come close. This is the week before option expiration week, where whipsaws are common. A possible scenario is that SPY may test the early December low near the 447 range.
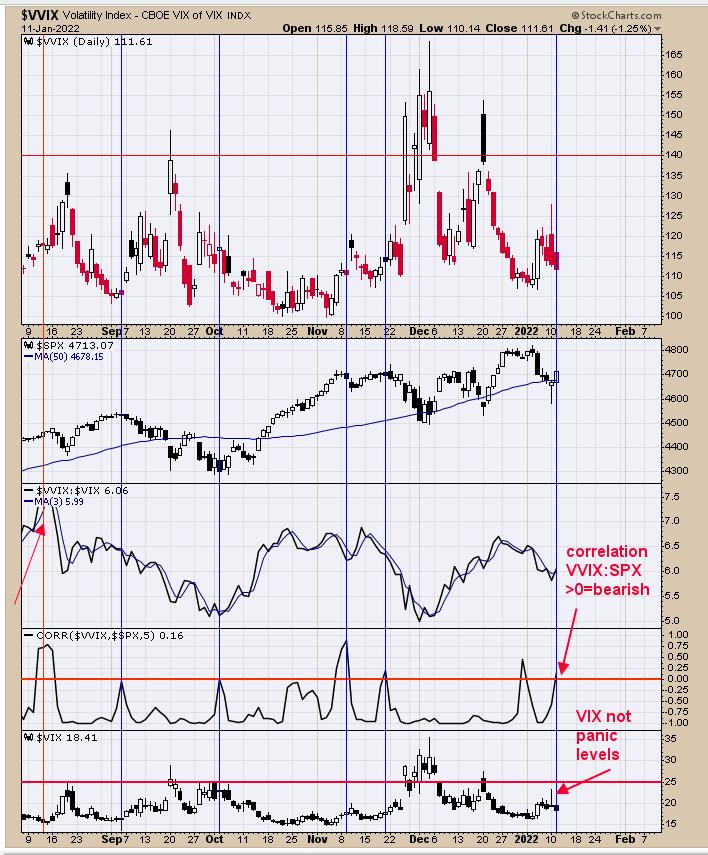
Market bottoms on panic and, if there's no panic, than most likely a bottom is not forming. There are several indicators that can major panic and VIX is one of them. The bottom window is the VIX. Normally, the VIX will close +25 or higher to show panic is present. Yesterday's low on the SPX (so far) only reached +20. The next window up is the correlation between the VVIX and SPX. When this correlation reaches >0, the market is near a reversal; today's reading came in at +.16. Forming tops can take longer to complete than bottoms and the market could hold up another couple of days, but, with no panic readings on the last low, this bounce should be short-lived.
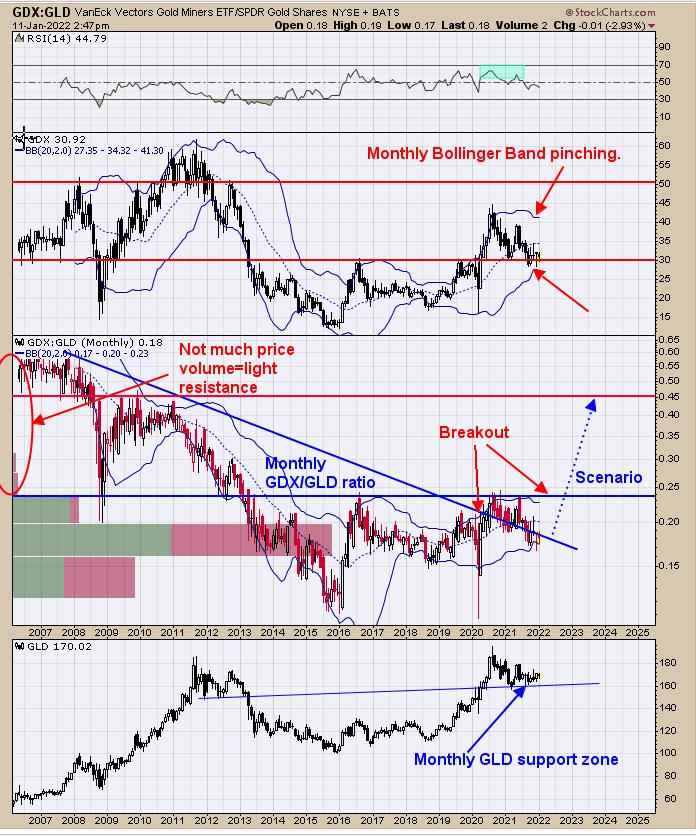
Above is the monthly GDX/GLD ratio. In up markets, this ratio rises; in down markets, it falls. We have noted a heading labeled "Breakout" in red. The first breakout came when the GDX/GLD ratio broke above the downtrend line connecting the highs going back to the 2011 (the blue line). I have been holding above this line in general since August 2020 near the .18 range. This ratio has been basing since 2013 (9 years) and is due for a breakout. So far this month, it is rising and a bullish sign. A break above the blue horizontal line near .24 would suggest the major rally has begun. This ratio has been finding support near its lower Bollinger Band. If the next rally in GDX is starting, than this ratio should continue to rise.
Tim Ord,
Editor
www.ord-oracle.com. New Book release "The Secret Science of Price and Volume" by Timothy Ord, buy at www.Amazon.com.