
SPX Monitoring Purposes: Short SPX 1/11/22 at 4713.07.
Monitoring Purposes GOLD: Long GDX on 10/9/20 at 40.78.
Long Term SPX Monitor Purposes: Neutral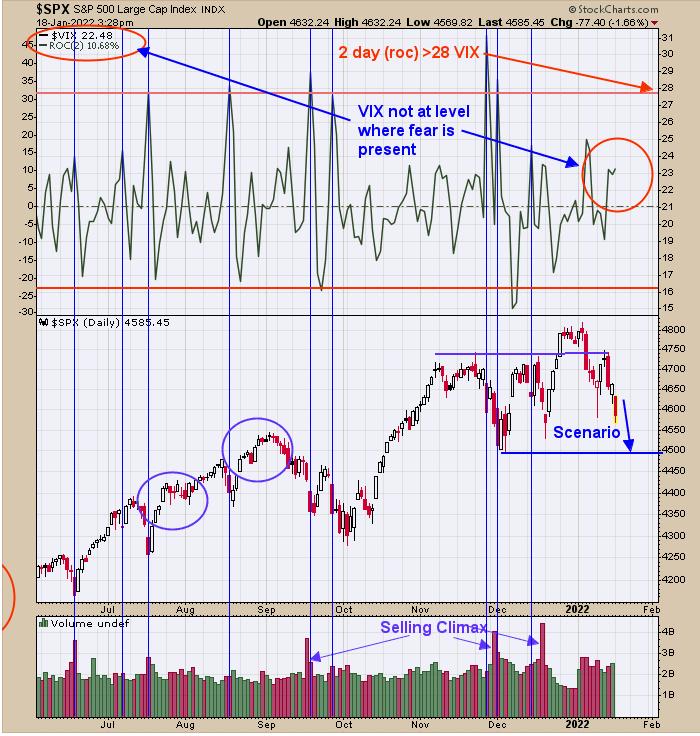
January 10 marked five days in a row down on the SPX; being down 5 days in a row predicts market will be lower within five days 87% of the time. Also, 2% declines usually come in clusters and the January 10 low was an over-2% decline. The TRIN has not reached panic levels so far on this decline, suggesting no worthwhile low has formed yet. Another indicator that helps to identify panic is present in the market is the VIX. The top window is the 2-day Rate of Change (ROC) for the VIX. When this indicator reaches +28, it marks panic as being present, and the market is near a low (marked with blue vertical lines), with the current reading being 22.71. A possible scenario is that SPX may test the early December low near the 4500 range. Today's decline did not produce panic readings in TRIN, TICK or VIX closes. When all three indicators show panic, that's when a bottom is near.
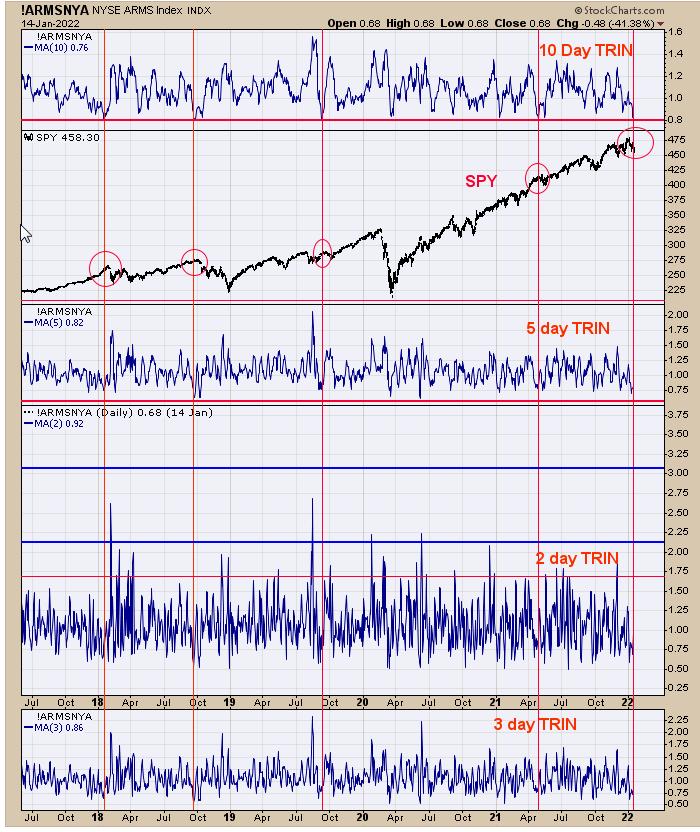
The top window is the 10-day average of the TRIN. This chart goes back to mid-2017 and shows the times when the 10-day TRIN was below .80, which is marked by red vertical lines (current reading is .76). The previous four times where 10-day TRIN was below .80 marked tops and some market intermediate-term tops. TRIN readings above 1.50 show there is fear in the market; fear is where bottoms form. With a 10-day TRIN near half of 1.50, it shows that fear is not present and, in turn, is a bearish sign. There is an old adage that says "where January goes, so goes the year". Short SPX on 1/11/22 at 4713.07.
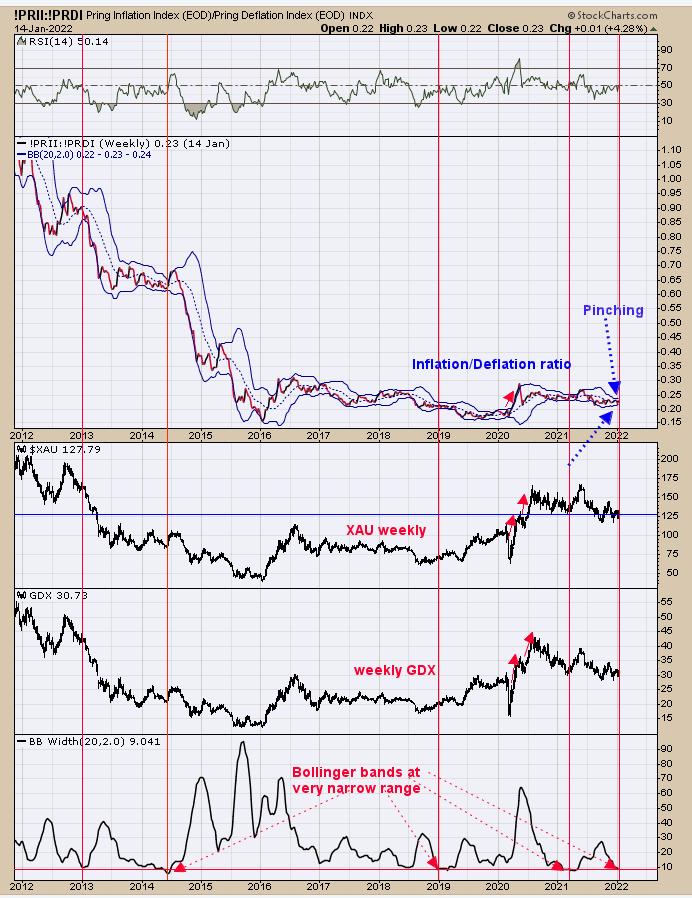
Above is the weekly Inflation/Deflation ratio and the bottom window is the Bollinger Bandwidth for this ratio. It's been about a year (March 2021) since the Bollinger Band width was this low. The red vertical lines show the times when the Bollinger Band width was below 10 (current reading is 9.041). The Bollinger Bandwidth below 10 doesn't give the direction of the move, only that at move is coming soon. We have other indictors that give the direction, which we have been pointing out in our reports and they show it will be up. It appears time is running out for this sideways action and an impulse wave to begin.
Tim Ord,
Editor
www.ord-oracle.com. New Book release "The Secret Science of Price and Volume" by Timothy Ord, buy at www.Amazon.com.