
SPX Monitoring Purposes: Covered 1/24/22 open 4356.32=7.57%; Short SPX 1/11/22 at 4713.07.
Monitoring Purposes GOLD: Long GDX on 10/9/20 at 40.78.
Long Term SPX Monitor Purposes: Neutral.
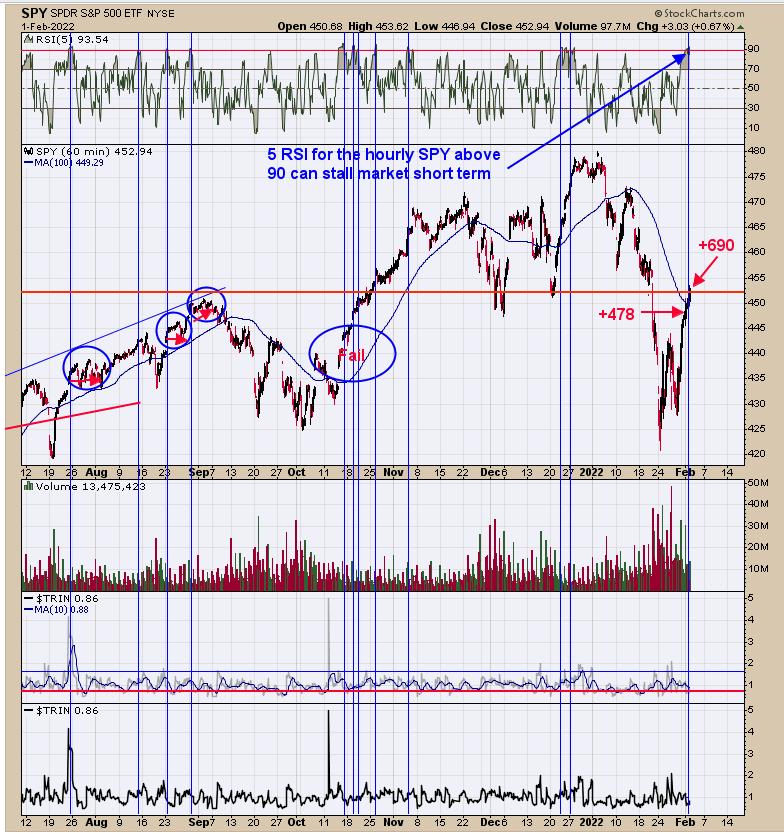
Above is an hourly chart of the SPY. Short-term exhaustion can occur when the TICK closes above +400 and especially when it happens two days in a row. Yesterday, the TICK closed at +478 and today at +690. Hourly 5-period RSI above +90 can also stall the market short-term, and the hourly 5-period RSI on the SPY closed at 93.54. It's also noteworthy that SPY is running into the low of December, which is a resistance zone. At some point, we expect the January 24 low may be tested, but that test may not show until later this month. Short term, market may stall, but don't have an ideal setup for a short SPX position.
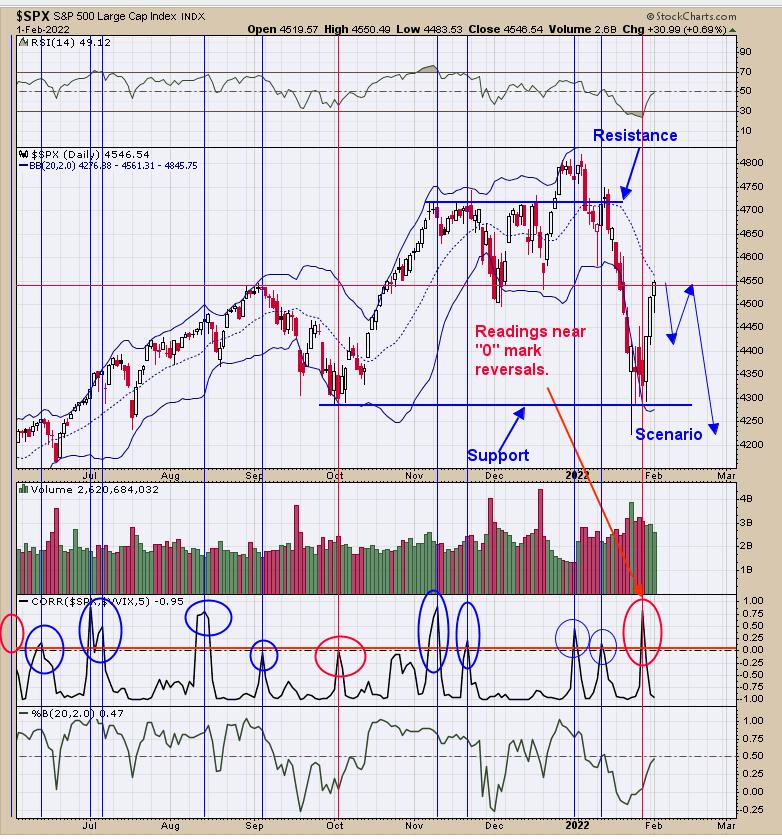
The second window up from the bottom is the correlation between the SPX and VVIX. When this correlation reaches above "0", the market is usually near a reversal. Ideally we would like to see this indicator approach 0 again to signal another reversal, this time for a high. Covered short SPX on 1/24/22 open at 4356.32 for gain of 7.57%. Short SPX on 1/11/22 at 4713.07.
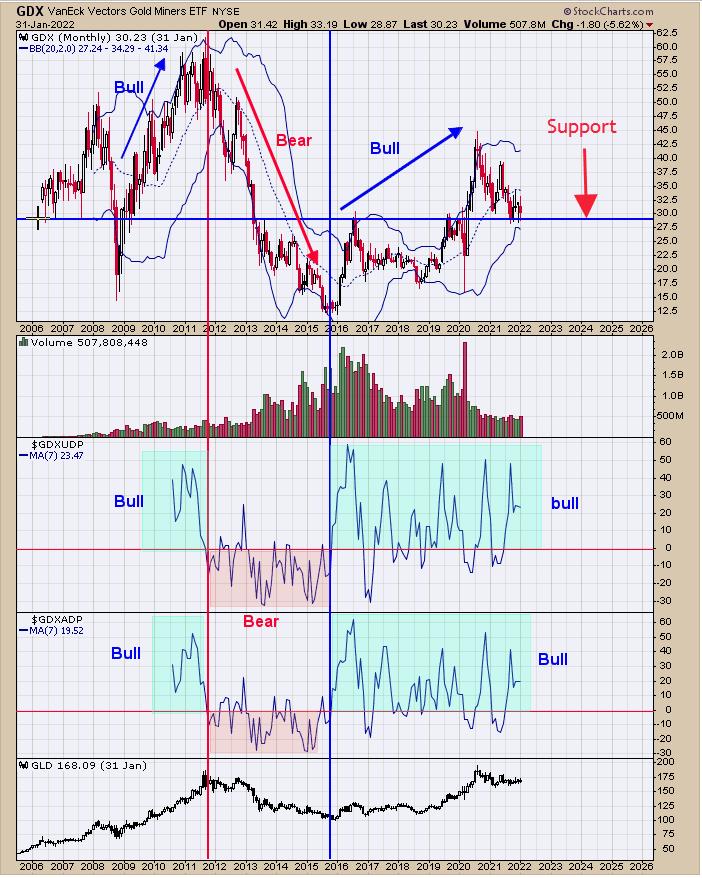
The above chart looks at the bigger picture, which is displayed in the monthly timeframe. The second window up from the bottom is GDX Advance/Decline percent with a 7-period average; the next window up is GDX up down volume percent with a 5-period moving average. Both indicators measure strength or weakness statistically in the advance declines and up down volume over time. In general, when both indicators are above "0", the trend is bullish, while below 0 is bearish. Back in 2011, both indicators fell below 0 and stayed below into late 2015. From late 2015 until the present, both indicators have remained above 0, which suggests a bullish trend is in force on the monthly timeframe. However, the short-term picture looks mixed. GDX is sitting on a major support, suggesting downside is limited. It's comforting to now that the bigger timeframes rule the shorter-term timeframes and the monthly charts remain bullish.
Tim Ord,
Editor
www.ord-oracle.com. New Book release "The Secret Science of Price and Volume" by Timothy Ord, buy at www.Amazon.com.