
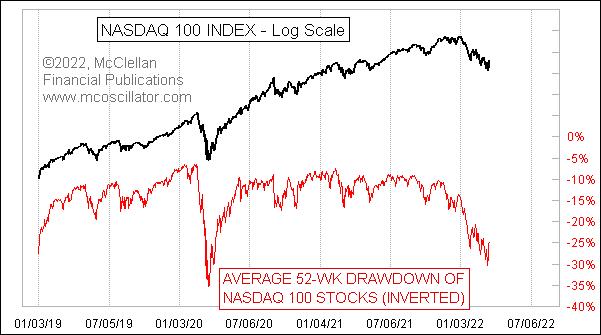
When the Nasdaq 100 Index (NDX) hit its low point (so far) for the current downtrend on March 8, 2022, the NDX was down 20.0% from its all-time high of 16,573, which was made on Nov. 19, 2021. That is for the index itself. But, on that same day, the average drawdown for the component stocks that make up the NDX was 28.8%. So how can it be that the average stock is down a bunch more than the index? Warning: there is math ahead.
The NDX is a cap-weighted index, meaning that the bigger stocks like AAPL and MSFT have more of an influence on the index value than the smaller ones. That is part of it. Another part of it is that not all of the component issues reach their own highs at the same time. So if you are examining each stock's lookback from its own 52-week high, the lookback periods can be different, which can magnify the average drawdown versus the index's drawdown.
That low of 28.8% for the average drawdown is pretty big and, for the period since 2019, it looks like a pretty extreme reading. Only the COVID Crash episode looks worse for this period of examination. But that can be the problem with a limited lookback period. If we don't include a genuine horrible bear market period in the lookback, then we can be misled. When one is worried about "How bad can it get?", one needs a broader perspective.
Here is a chart showing a bit longer lookback, for the purpose of adding context:
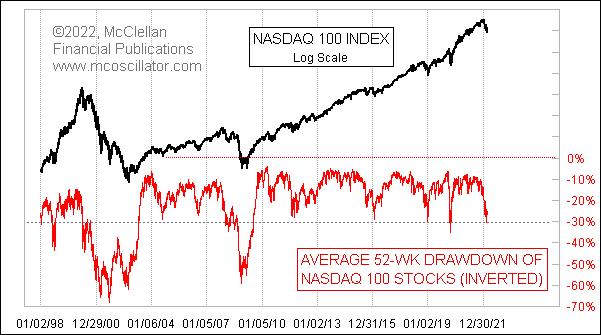
During the period of the Fed doing Quantitative Easing (QE), since 2009, an average drawdown of anything close to 30% had marked a great buying opportunity. This current one may be another in that series of juicy oversold bottoming opportunities. But, looking back farther, we saw much bigger average drawdown readings for NDX stocks during the 2008 bear market, and even more so in the aftermath of the 2000 Internet Bubble top.
So here is where the analysis gets easy. If we could know that we are still in the new era mode of the QE era, then a 20%+ drawdown reading is a great buying opportunity. But if the rules of market action of longer-ago eras are still relevant, then it is still possible that greater ugliness is in store. So here is all you have to do to be a stock market genius -- just know if we are in an OMG bear market or merely an ordinary Fed-protected occasional dip. Then you can know what to do.
The real world is not that easy. Your mileage may vary. This current condition is for sure a verifiable oversold condition. And that will someday matter. But it is not required to matter right now, just because we notice an oversold condition. That is the trouble with the actual stock market -- it does not always comport itself in accordance with theory, or our expectations.