
SPX Monitoring Purposes: Long SPX on 3/25/22 at 4543.06.
Monitoring Purposes GOLD: Long GDX on 10/9/20 at 40.78.
Long Term SPX Monitor Purposes: Neutral.
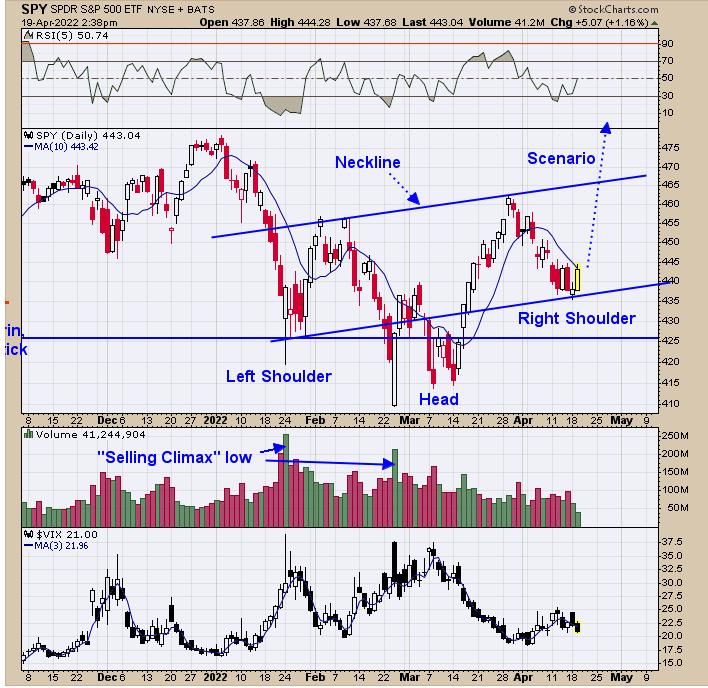
The pattern forming on SPY appears be a Head-and-Shoulders pattern, where the late February and early March lows form the Head, the Left Shoulder is the January low and the Right Shoulder is the April low. The pattern looks symmetric, which adds to the creditability. To keep the symmetry of this potential Head and Shoulders bottom, the market would need to show strength very shortly; otherwise, the symmetry would be lost. It's worth noting that, if April Options Expiration Week is down (it was down 2.13%; this has happened 10 times in the last 30 years) the next week (this week) is up 100% of the time. Today's rally gives this statement hope.

We updated this chart from yesterday, when we said "Significant lows are made when the NYSE McClellan Oscillator falls below -300 (capitulation) then rallies to +200 (sign of Strength). The NYSE Summation index is in the bottom window. We got this setup at the end of March. To confirm an intermediate term up trend, the NYSE Summation index needs to turn up from below -700 (check) and then rally to +1000. Currently, the Summation index stands at -185. Usually, the duration of the Summation index low below -700 to +1000 is around two months. The low in the Summation index came on March 10, so around May 10, the Summation index ideally should be above +1000, which is about 3 ½ weeks away. If the Summation index fails to break above the +1000 level (or at least close to +1000) around May 10, than the market failed to show strength off of a significant low and would be an intermediate-term bearish sign. Therefore, it's important for the market to show strength right now and continue to show strength for the next 3 or 4 weeks." Today's rally was a good start and needs to continue for the next 3 to push the Summation index up near +1000.

There is no cause for concern right now, but there will be when the Bullish Percent index for the Gold miner's index hits 100%; the last two times, GDX was at an intermediate-term top. The Bullish percent index is sitting at 83% (83% of the stocks in the Gold miners index are on a Point and Figure buy signal). The chart above goes back to 2008 and shows all the history for the bullish percent index. According to our indicators, which you have seen in our reports, the bull market has further to go both in time and price, but when the Bullish Percent index gets to 100%, the market will be due for a rest.
Tim Ord,
Editor
www.ord-oracle.com. New Book release "The Secret Science of Price and Volume" by Timothy Ord, buy at www.Amazon.com.
Signals are provided as general information only and are not investment recommendations. You are responsible for your own investment decisions. Past performance does not guarantee future performance. Opinions are based on historical research and data believed reliable, there is no guarantee results will be profitable. Not responsible for errors or omissions. I may invest in the vehicles mentioned above.