
SPX Monitoring Purposes: Long SPX on 3/25/22 at 4543.06.
Monitoring Purposes GOLD: Long GDX on 10/9/20 at 40.78.
Long Term SPX Monitor Purposes: Neutral.
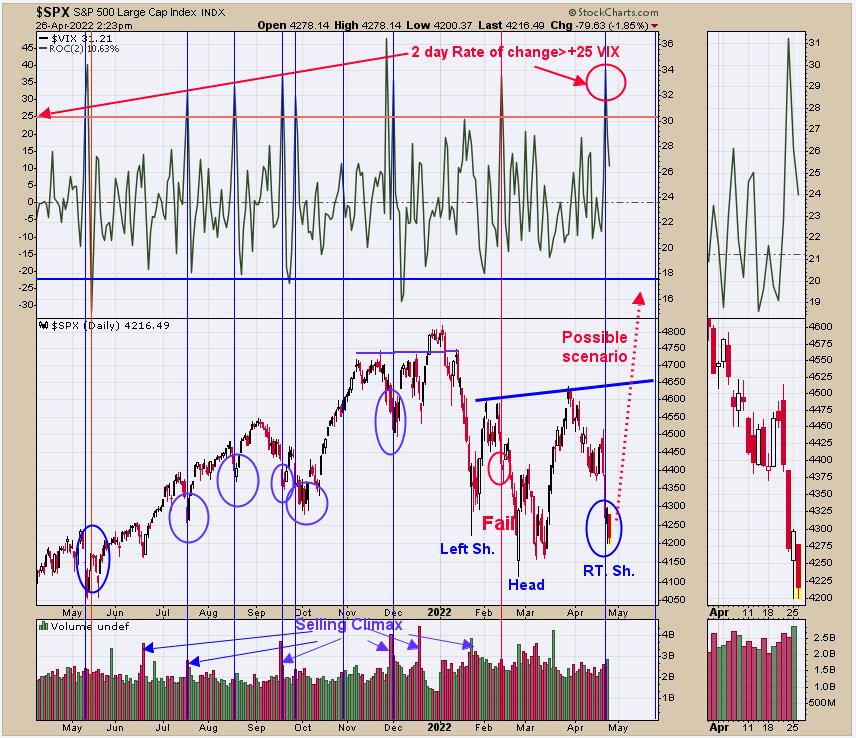
We updated this chart from yesterday, when we said "the top window is the 2 day (Rate of Change) for the VIX. Readings above 25 on this indicator (current reading is 26) suggests a low is near; this has happened 8 times since last May with one failure, which works out to an 88% success rate. The pattern forming on SPX could be a head-and-shoulders bottom, where the Right Shoulder is completing now. This potential head-and-shoulders bottom has an upside target to 5150, which would be a new high. Don't have it shown, but the NYSE Summation index needs to see +1000 range near mid May for a bull market signal (on a previous report) for 2022; otherwise, it's sideways market at best this year." Added to the above, today's light volume test of Monday's low is a bullish sign, suggesting a bottom is forming.
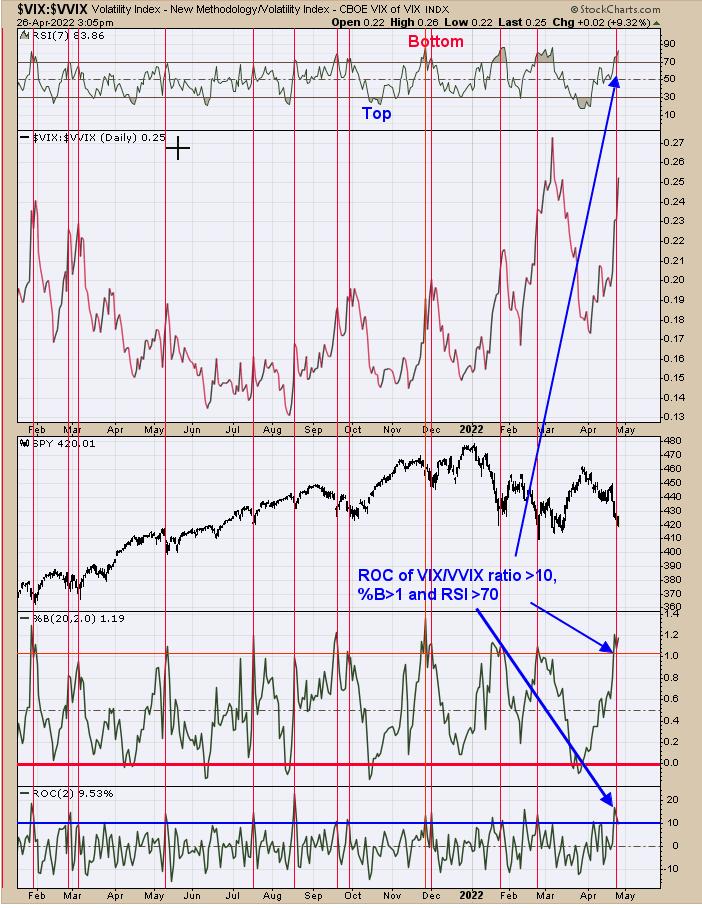
VIX measures the fear in a market and the VVIX is the VIX of the VIX. So the VIX/VVIX ratio is a good indicator that can define panic, and panic only forms at bottoms in the market. The acceleration of the VIX/VVIX ratio helps to pinpoint where all the panic is occurring. The bottom window is the "Rate of Change" (ROC) of the VIX/VVIX ratio; high readings above +10 suggests panic (high came in yesterday +15). The next window up is the Percent B, which shows when it above its upper Bollinger Band (>1) or below its lower Bollinger band (<0). Percent B of the VIX/VVIX reached above +1 a couple of days ago, suggesting the VIX/VVIX ratio has gone up to fast and is due to normalize. The top window is RSI for the VIX/VVIX ratio, which also measures acceleration and shows excess when readings reach above +70 (current reading is 84). We used red lines to mark the times when all three indicators for the VIX/VVIX ratio reached bullish levels. Will this time be different?
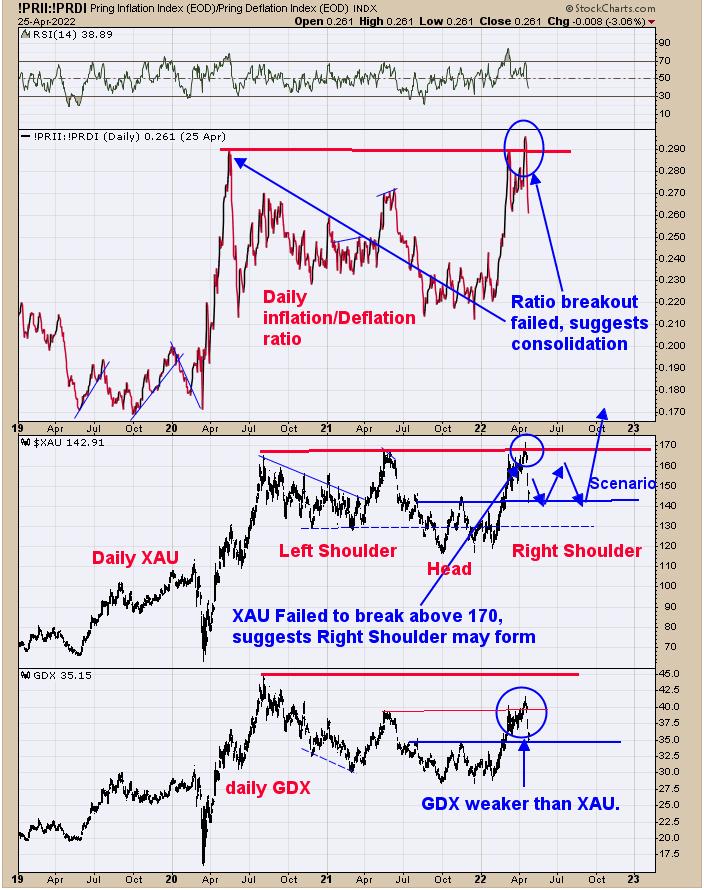
The top window is the Inflation/Deflation ratio. Last week, it closed above its previous 2020 high, suggesting a breakout. Right after that high, it tumbled the next four days, creating an "upthrust" and suggesting a consolidation is starting. If the Inflation/Deflation ratio starts a consolidation, so will the XAU (GDX). As pointed out in yesterday's report, the pattern that may be forming on XAU is a head-and-shoulders bottom where the head is the October low. Head-and-shoulders patterns have symmetry both in time and price. The Left Shoulder formed over 5 months and suggests the Right Shoulder may take as long; it could complete in the October or November timeframe. Still a bull market, but sideways action over the next 5 or 6 months is possible.
Tim Ord,
Editor
www.ord-oracle.com. New Book release "The Secret Science of Price and Volume" by Timothy Ord, buy at www.Amazon.com.
Signals are provided as general information only and are not investment recommendations. You are responsible for your own investment decisions. Past performance does not guarantee future performance. Opinions are based on historical research and data believed reliable, there is no guarantee results will be profitable. Not responsible for errors or omissions. I may invest in the vehicles mentioned above.