
SPX Monitoring Purposes: Long SPX on 3/25/22 at 4543.06.
Monitoring Purposes GOLD: Long GDX on 10/9/20 at 40.78.
Long Term SPX Monitor Purposes: Neutral.
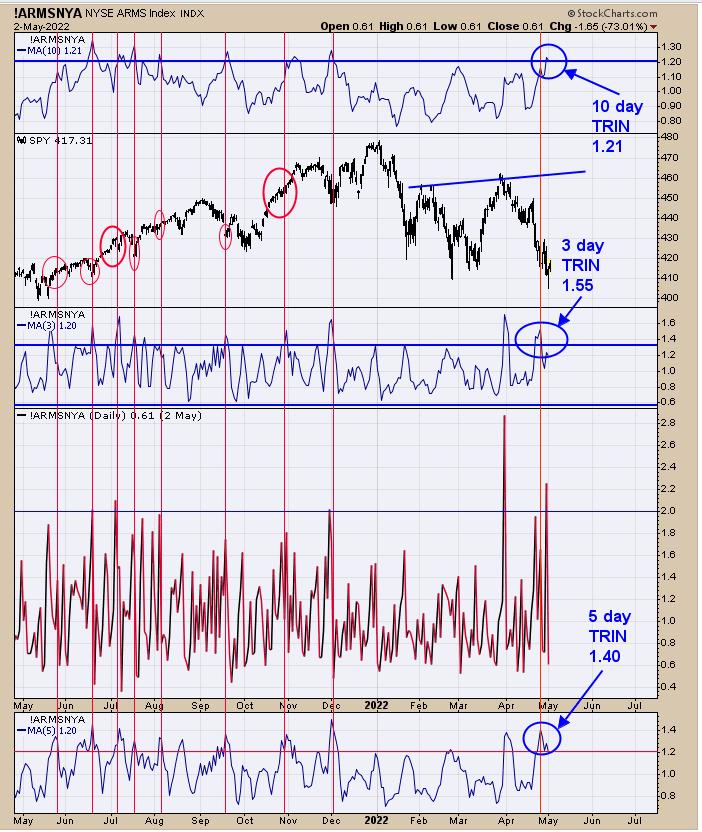
The above chart shows the TRIN with a 5-day average (bottom window), a 3-day average (middle window) and the 10-day average (top window). The red vertical shows the times when 3-, 5- and 10-day average of the TRIN reached bullish levels. Each time, the market was either at a bottom or in the process of a rally. The 10-day TRIN just ticked to a bullish level on Friday with a reading above 1.20. Got panic in a lot of different indicators starting on April 26, and panic are what bottoms are made of. Need to see a "Sign of Strength" of this low to keep larger trend bullish.
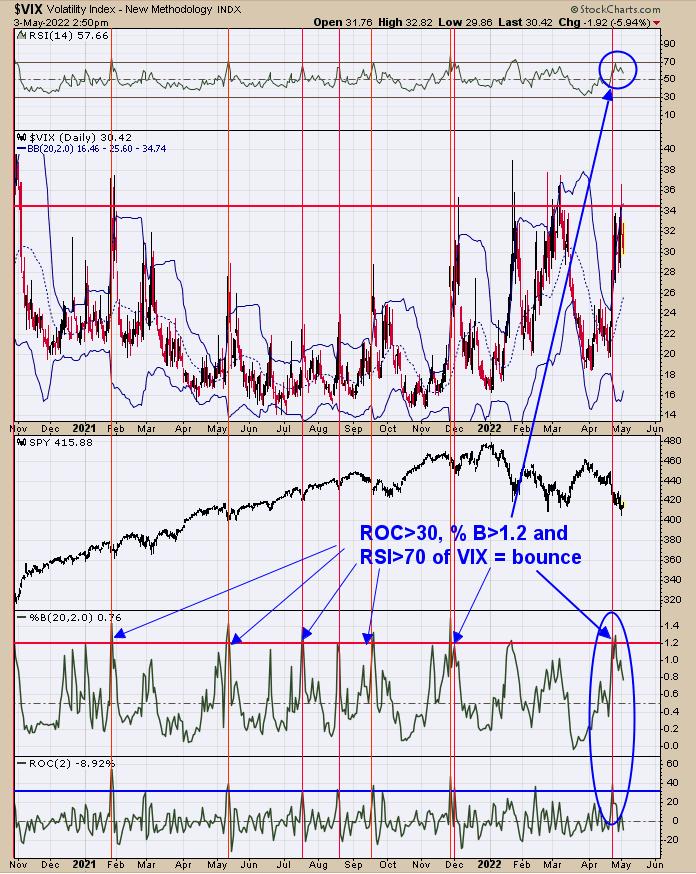
Panic forms at lows in the market and a lot of panic started to from starting April 26. The second window down from the top is the daily VIX. The top window is the RSI for the VIX. RSI readings for the VIX >70 suggests a large acceleration of the VIX, which is a form of panic, and the RSI hit the 70 range on 4/26. The bottom window is the Rate of Change for the VIX; readings above 30 also shows an acceleration of the VIX, and the 30 range was hit on 4/26. The next window higher is the Percent Bollinger Band, which shows readings above 1.00 when VIX hits its upper Bollinger Band; readings above 1.20 implies VIX hast gone up to fast and should normalize back to .5 or lower. Percent B traded above 1.20 also on 4/26. Its fairly rare to get all three indicators to extreme levels (happens every 3 months or longer). The last time came with the early December 2021 low, nearly five months ago.
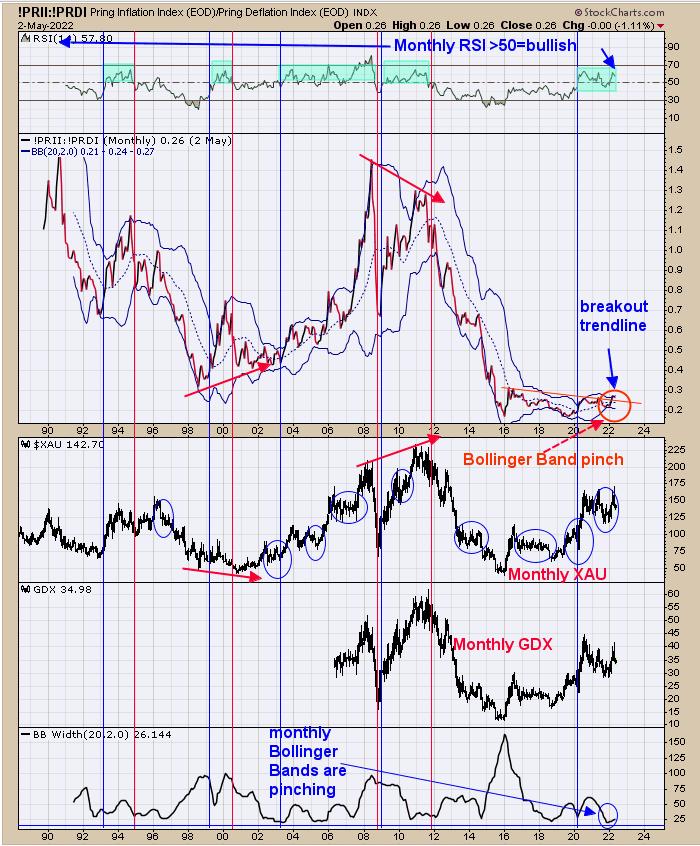
We updated this chart from past reports, which is the monthly Inflation/Deflation ratio. We pointed out earlier this year that the monthly Bollinger bands are pinching on this ratio, suggesting a large move is nearing. Since then, the monthly Bollinger Bands are just starting to expand, suggesting this large move is beginning. Notice also that the ratio has closed above its trend line, connecting the high going back to 2016, which is a breakout. The top window is the RSI for this ratio, which is above 50, showing this ratio is in an uptrend. Another bullish factor is that the ratio is above its mid-monthly Bollinger Band. The monthly chart remains bullish and, according to the studies on this page, the rally is in the early stages of a bullish move.
Tim Ord,
Editor
www.ord-oracle.com. New Book release "The Secret Science of Price and Volume" by Timothy Ord, buy at www.Amazon.com.
Signals are provided as general information only and are not investment recommendations. You are responsible for your own investment decisions. Past performance does not guarantee future performance. Opinions are based on historical research and data believed reliable, there is no guarantee results will be profitable. Not responsible for errors or omissions. I may invest in the vehicles mentioned above.