
SPX Monitoring Purposes: Long SPX on 5/31/22 at 4151.09.
Monitoring Purposes GOLD: Long GDX on 10/9/20 at 40.78.
Long Term SPX Monitor Purposes: Neutral.
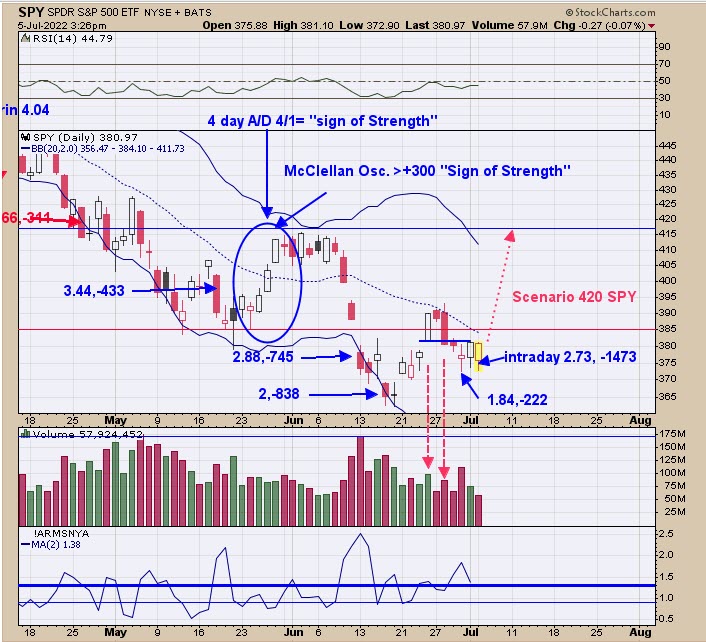
We marked the close prices in blue for the TRIN (first #) and TICK (second #) over the last couple of weeks. A TRIN close above 1.30 show panic and a TICK close below -200 show panic, and panic is what stock market bottoms are made of. The TRIN closed Thursday at 1.84 and the Tick at -222, which are bullish and suggest a bottom is near. We listed the panic TRIN and TICK closes over the last couple weeks, which came in the ranges of 365 to 380. SPY levels suggest support and that intermediate term low may be forming. We also noted today's intraday reading for the TRIN (2.73) and TICK (-1473); these readings came near the low for today. We may see a rally coming that could test the early June high near 420 on the SPY.
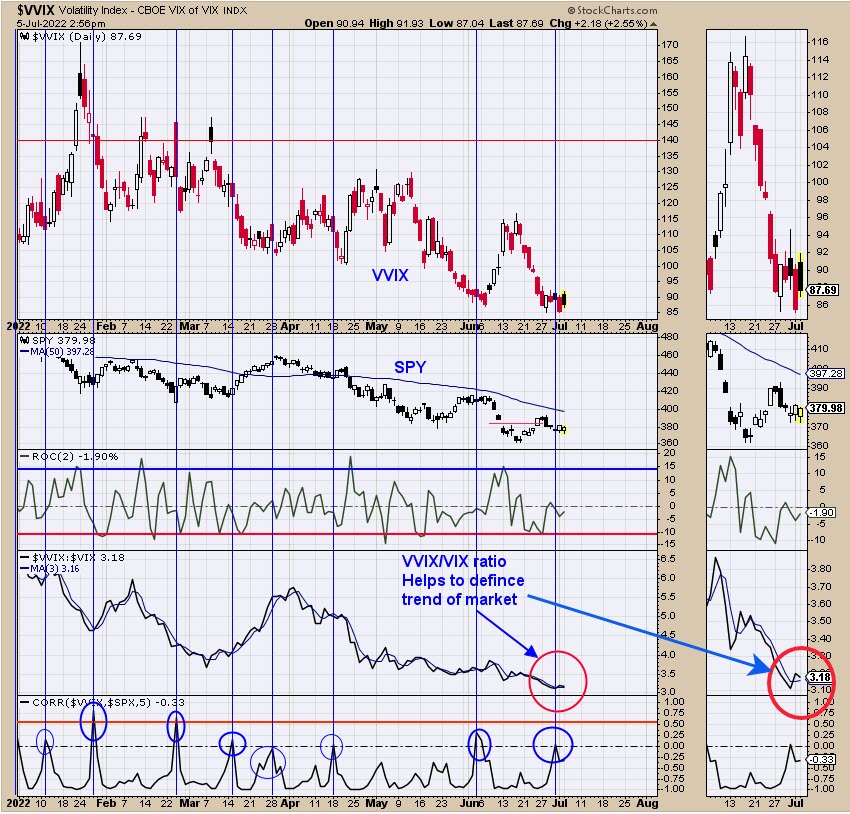
The bottom window is the correlation between the VVIX and SPX. When this correlation gets above "0" and turns down, it suggests a reversal in the market is near, but doesn't give a direction. The next window up helps with the direction part of the equation, which is the VVIX/VIX ratio with a 3-period moving average. This ratio helps to define the direction of the SPY. Last week, it turned up, suggesting the SPY may start to rally from here.
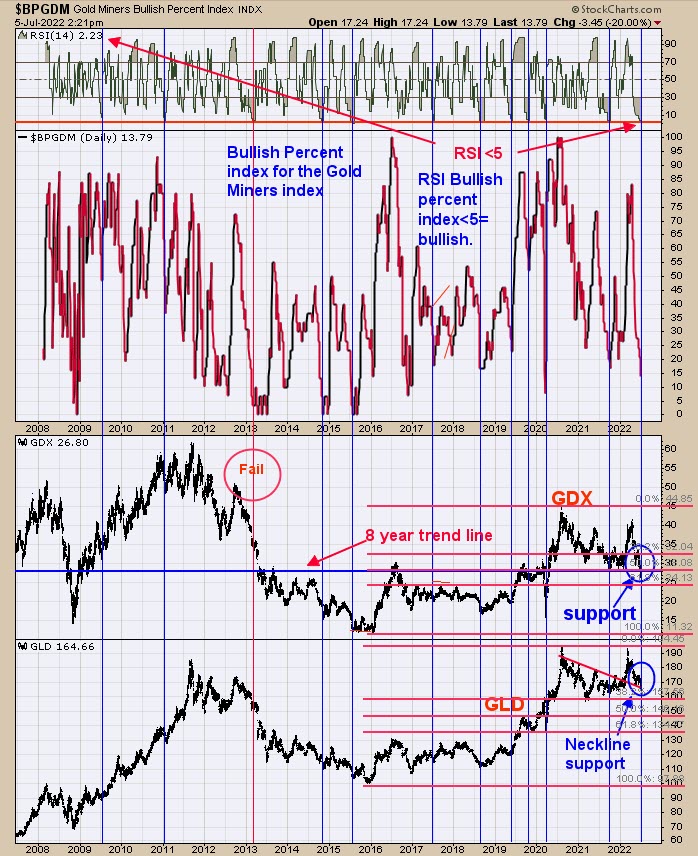
Last week, we said, "'Rare signal generated on GDX. The last time this type of signal was generated was last October low. The signal is the RSI for the Bullish Percent index for the Gold Miners index. When the RSI for the Bullish Percent index falls below 5 (current reading is 4.40), the market was at an intermediate-term low.' This chart is displayed above and updated to current data. We took this indicator back to where it began, which is 2008. There have been eleven signals of this type (not counting the current signal) going back to 2008 and there where one failure in 2013 (middle of a major bear market for Gold and gold stocks), which works out to a 91% success rate. Of the 10 signals that did work out, all had good rallies and some turned into major advances. All major signals are hard to stick with and the current one is no different." Added to the above, the RSI for the Bullish Percent index for the Gold Miner's index stands at 2.23. We added Fibonacci retracements, which GDX stands at 50% and GLD at 38.2%, showing GLD holding up better than GDX. Either this is like 2013 (marked with Fail on chart above) or the market is making a bottom here like the other 91% of the time. At major lows in GDX, there is a "Flush", and maybe that is what is going on here.
Tim Ord,
Editor
www.ord-oracle.com. New Book release "The Secret Science of Price and Volume" by Timothy Ord, buy at www.Amazon.com.
Signals are provided as general information only and are not investment recommendations. You are responsible for your own investment decisions. Past performance does not guarantee future performance. Opinions are based on historical research and data believed reliable, there is no guarantee results will be profitable. Not responsible for errors or omissions. I may invest in the vehicles mentioned above.