
SPX Monitoring Purposes: Neutral.
Monitoring Purposes GOLD: Long GDX on 10/9/20 at 40.78.
Long Term SPX Monitor Purposes: Neutral.
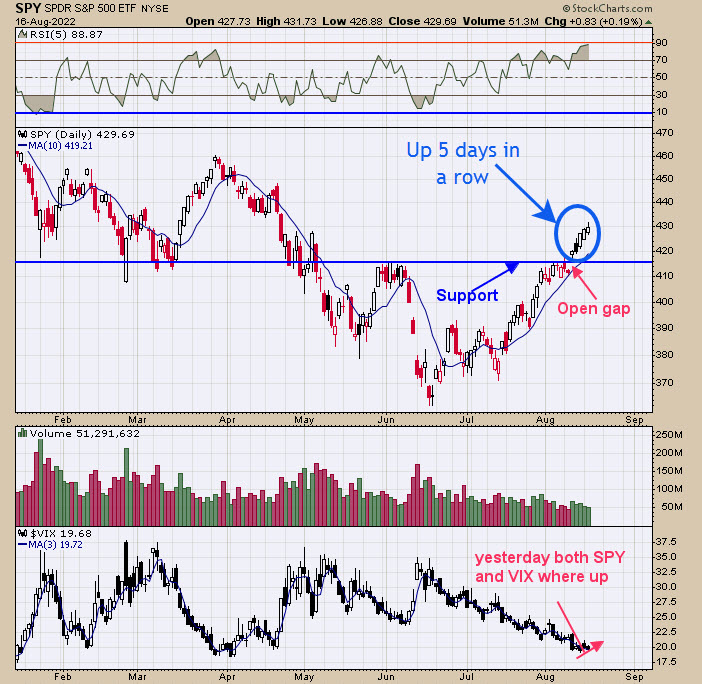
There appears to be strong support near the 415 SPY range. The SPY did gap through that range and left on open gap, which is a potential target. Yesterday, both SPY and VIX were up, suggesting the SPY was near a short-term high. Last Friday, the SPX McClellan Oscillator closed 97.61; Oscillator readings near +100 usually produce a stall in the market short term (see page 2). The SPY was up five days in a row, which predicts the market will be higher within 5 day 83% of the time. We found that, after the next high after five days up, the market goes through a larger consolidation. The third quarter weakness (which runs to 9/30) may still work out. Staying neutral for now.

We updated this chart from yesterday, when we said, "The bottom window is the SPX stocks above their 50-day averages which stands at 90.80%, which is a strong showing. The top window is the SPX McClellan Oscillator. Readings near +100 is another way of showing a 'Sign of Strength.' Friday's SPX Oscillator closed at 97.61 and July 29 at +100.57; two readings in the +100 range within two weeks. The last time we had two +100 readings within two weeks was when we were coming off the March 2020 low. Notice also that, when the SPX Oscillator reached +100 ranges, the SPX had a short-term consolidation. The last time, July 29, flipped the market sideways for seven day. The current Oscillator near +100 reading may also stall the market for the next several days." The stall pattern appears to be taking hold.

The middle window is the monthly XAU/gold ratio, which goes back to 1989. The monthly XAU/Gold ratio has been trending down since the peak in 1995, forming a falling type wedge pattern. Since 2014, the XAU/Gold ratio flipped sideways and appears to be building a base. There are two trend lines; one connecting the horizontal highs going back to 2014 (red line) and another connecting the highs going back to 1995 (blue line). Over the last year-and-a-half, this ratio has been hovering around both trend lines. We will come back to this ratio in a minute; the bottom window is the monthly Gold chart. The gold chart appears to be building a Head-and-Shoulders bottom and the Right Shoulders appears nearly complete. If this pattern is a Head-and-Shoulders bottom and breaks the Neckline near 2000, then, most likely, the XAU/Gold ratio will follow and break higher as well. With an 8-year base for the ratio, it will fuel the next run for several years. When this ratio is rising, than gold stocks are outperforming gold and gold stocks will lead the way higher.
Tim Ord,
Editor
www.ord-oracle.com. New Book release "The Secret Science of Price and Volume" by Timothy Ord, buy at www.Amazon.com.
Signals are provided as general information only and are not investment recommendations. You are responsible for your own investment decisions. Past performance does not guarantee future performance. Opinions are based on historical research and data believed reliable, there is no guarantee results will be profitable. Not responsible for errors or omissions. I may invest in the vehicles mentioned above.