
SPX Monitoring Purposes: Neutral.
Monitoring purposes GOLD: Long GDX on 10/9/20 at 40.78.
Long Term SPX Monitor Purposes: Neutral.
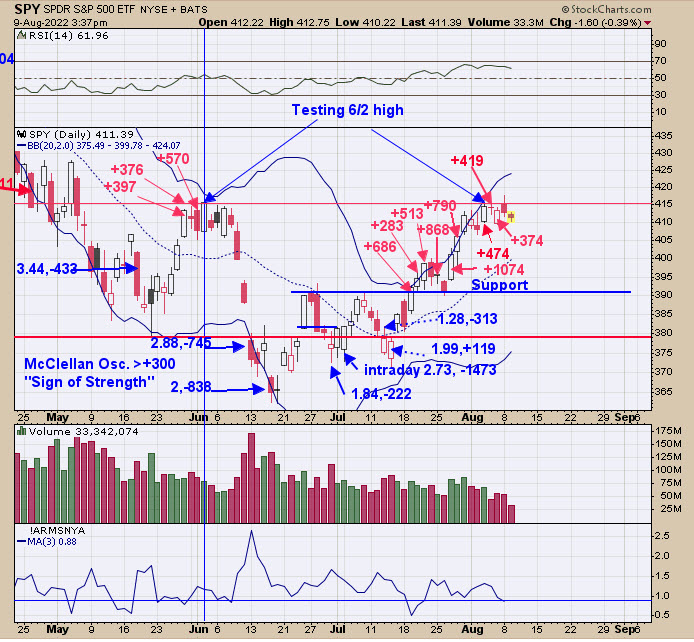
The SPY has gone virtually sideways over last week and a half. The longer the sideways pattern, the larger move once the breakout occurs. The sideways pattern doesn't give the direction of the breakout; we have to rely on indicators to give us hints of what that direction will be. The closing TICKs readings suggest a pull back is coming. The numbers in red are the TICK closes, and closes above +350 suggest short-term exhaustion. The last three days of last week came in at +374, +419 and +474. The TRIN closed on 8/1 at 1.45; 8/2 at 1.38; 8/3 at 1.17 and 8/4 at 1.23, which all lean bullish. In general, we have bullish TRIN closes and bearish TICK closes, which works out to be neutral for the market short-term. Seasonality is bearish to September 30. It's possible that a trading range may be developing in this Seasonality period. A bit longer-term is for a fourth quarter rally that could run into year-end. For that to happen, we would need the TICK and TRIN to show panic readings before the rally starts, and that could happen at the end of September. Don't see a good setup for the moment and will remain neutral.
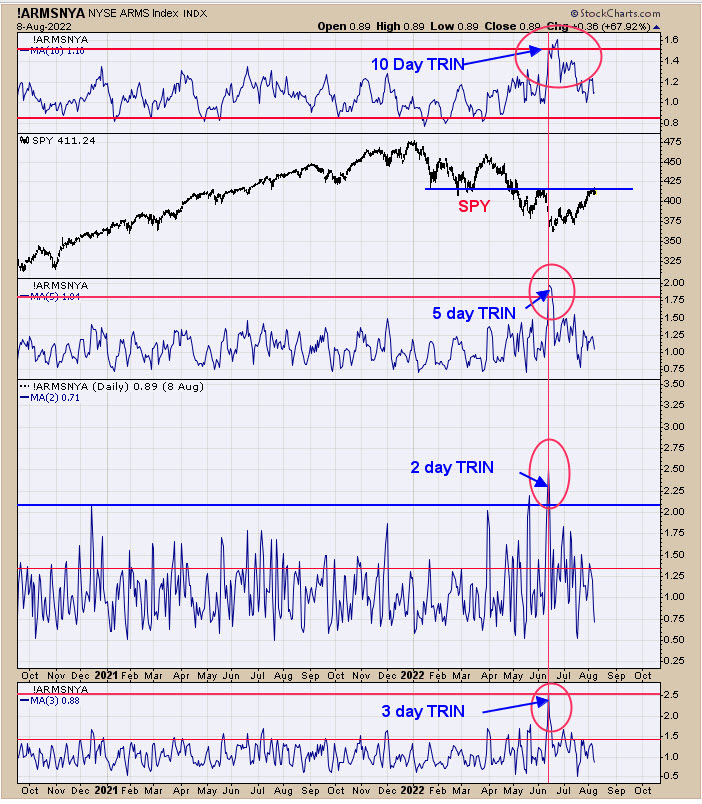
The top window is the 10-day average of the TRIN; the next window down is the daily SPY; next down is the 5-day average of the TRIN; next lower is the 2-day average of the TRIN; and the bottom window is the 3-day average of the TRIN. Implied panic in the market is recorded when the TRIN closes above 1.30, and panic forms at bottoms in the market. The more panic readings there are, the more lasting the bottom. When the 10-day TRIN reaches above 1.50, the market is near an intermediate-term low. Going into the mid-June low, the 2-, 3-, 5- and 10-day TRIN all reached panic levels, suggesting the mid-June low could be the low for the year.
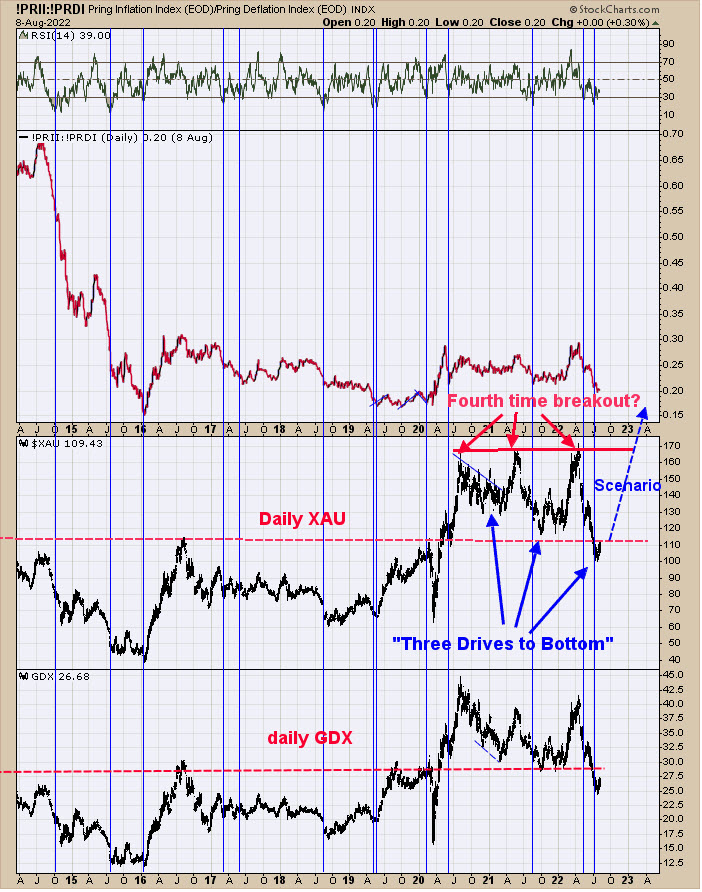
We have been looking at the bigger picture to see what lies ahead. The top window is the RSI for the Inflation/Deflation ratio. Intermediate-term lows have formed when the RSI for this ratio falls below 30, which is identified with blue vertical lines. This indicator is pretty good, but what catches our eye is that the pattern forming on the XAU appears to be a "Three Drives to a Bottom". This pattern predicts that, after the third low (which is forming now) is a minimum upside target to where the pattern began, which, in this case, is back to the 170 range. The 170 range is where the past three highs have formed. The more times a high is tested, the higher the probability that high will be exceeded. Our opinion will be that the 170 XAU on the next test will be exceeded. The two-year sideways trading range is due to end and an impulse wave is due to start.
Tim Ord,
Editor
www.ord-oracle.com. New Book release "The Secret Science of Price and Volume" by Timothy Ord, buy at www.Amazon.com.
Signals are provided as general information only and are not investment recommendations. You are responsible for your own investment decisions. Past performance does not guarantee future performance. Opinions are based on historical research and data believed reliable, there is no guarantee results will be profitable. Not responsible for errors or omissions. I may invest in the vehicles mentioned above.