
SPX Monitoring Purposes: Long SPX on 11/10/22 at 3956.27.
Monitoring Purposes GOLD: Long GDX on 10/9/20 at 40.78.
Long Term SPX Monitor Purposes: Neutral.
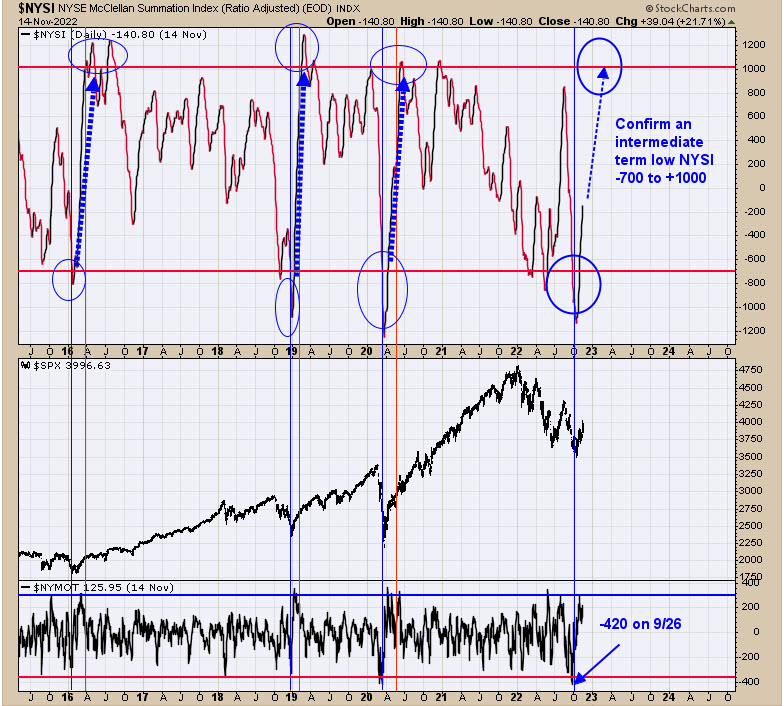
Yesterday, we said "The top window is the NYSE Summation index. A bullish sign is created intermediate term when the Summation index falls below minus 700 (extreme oversold) and then rallies to +1000 in around a two-month period. Early October, the Summation index fell below -1000, meeting the first requirement, and it now needs to rally to +1000 around early- to mid-December. We are about halfway in time on the rally back to +1000 and the Summation index starts at -179 as of Friday's close. We have market previous instances when the Summation index fell below -700 and then rallied to +1000 starting from 2016. In those instances, all worked out well." The Summation index moved to -140 and is moving in the right direction, and needs to move higher into early to mid December above +1000 for a bullish outcome. Don't see any excess in TICK or TRIN to suggest a high is near. The upper weekly Bollinger band on SPY comes in near 430, which is also the August high and could be a resistance area.
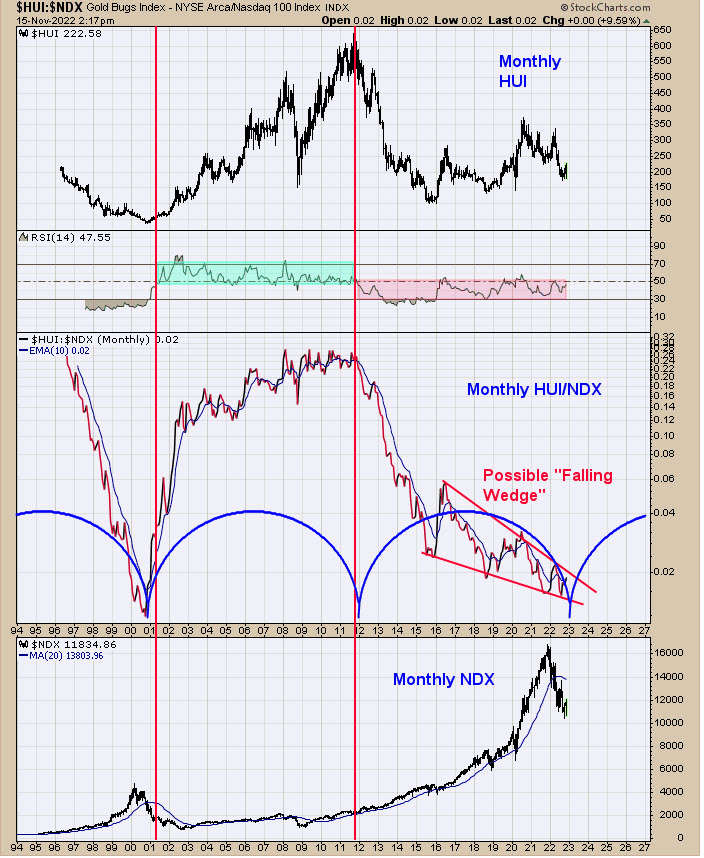
Above is a longer-term view of what could be developing between HUI and NDX. Above is the monthly HUI/NDX ratio going back to 1994. The window above the monthly HUI/NDX ratio is the RSI for this ratio. When the RSI is above 50, then, in general, HUI is out performing NDX, whereas, when below, the NDX is outperforming HUI. From 2001 to late 2011, the RSI was above 50 and HUI outperformed NDX, as that ratio was rising in that timeframe. Since late 2011 to the current time, the RSI has been below 50 and NDX has been out performing HUI. We drew a cycle line (half moon in blue) that is coming in at the end of this year, which could represent a turn in the HUI/NDX ratio. Notice also the HUI/NDX ratio could be drawing a "Falling Wedge" pattern. "Falling Wedge" patterns have upside target to where they began; in this case, that would be a rally back to .05 area. We have shown evidence in our reports that GDX (XAU, HUI) may have made at least an intermediate-term low, if not a longer-term low. Strength in NDX (SPX) needs to be seen in the coming weeks for a longer term bullish outlook. If strength fails to show up into year-end, then NDX could underperform next year. Money will go where the strength is.
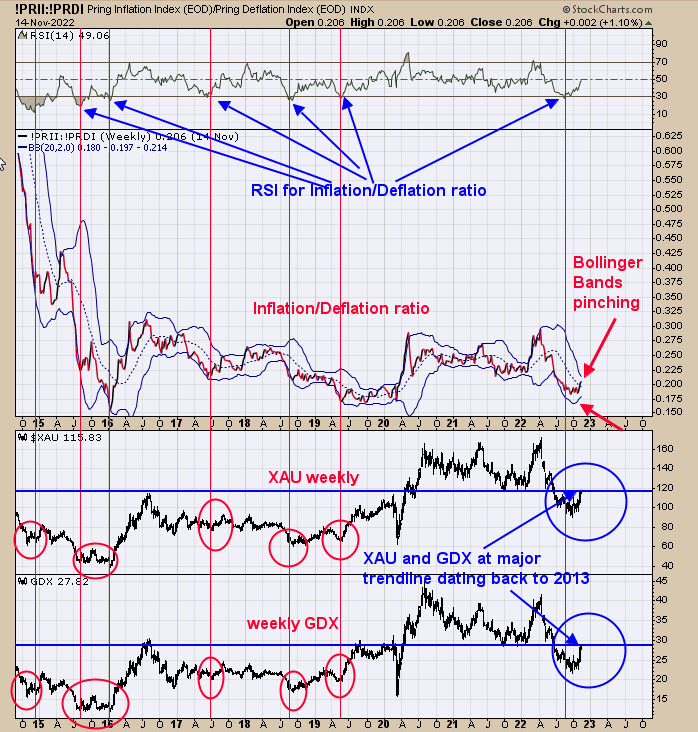
We have presented this chart in the recent past. The bullish setup is when the weekly RSI for the Inflation/Deflation ratio trades below 30 and then turns up, noted with red lines. The last signal came in August of this year. We have a new development that we want to point out, which is that both the weekly XAU and GDX (circled in blue) are at major trend lines dating back to 2013. A "Sign of Strength" is needed to get back above these trend lines. The middle chart is the weekly Inflation/Deflation ratio, and we noted that the Bollinger Bands are pinching, suggesting and impulse wave is nearing on this ratio. We have pointed out several weekly buy signals on previous reports for GDX and XAU, which in turn suggests the impulse wave on Inflation/Deflation ratio will be up. A impulse rise in the Inflation/Deflation ratio will suggests a impulse rise in GDX and XAU. It appears we are in the early stages of a strong rally in GDX and XAU and may get stronger as the ratio starts its impulse wave.
Tim Ord,
Editor
www.ord-oracle.com. Book release "The Secret Science of Price and Volume" by Timothy Ord, buy at www.Amazon.com.
Signals are provided as general information only and are not investment recommendations. You are responsible for your own investment decisions. Past performance does not guarantee future performance. Opinions are based on historical research and data believed reliable; there is no guarantee results will be profitable. Not responsible for errors or omissions. I may invest in the vehicles mentioned above.