After the fall in stocks on January 19, 2023, someone asked me if I was still bullish. My answer: "As long as the New York Stock Exchange Advance Decline line ($NYAD) remains above its 200-day moving average (MA), the bulls get the benefit of the doubt." On January 20, 2023, the market moved decidedly higher, regaining much of what it had lost in the prior two days.
Don't get me wrong. Nobody knows what's going to happen at any moment in the stock market. Yet there are reliable indicators that smooth out the daily price gyrations. One of them is the market's breadth. And my favorite indicator with which to smooth things out is the $NYAD.
That's because the market's internals (the term used by technicians to refer to the market's breadth as measured by $NYAD and similar indicators) now lead the indexes more often than in the past, where indexes were the primary indicators of the market's trend.
The reason for this is twofold. First, indexes are capitalization-weighted. That means that mega-cap stocks can swing the price of an index wildly, distorting the price trend. For example, a bad earnings report for a major stock can cause a fall in the S&P 500 index ($SPX) during a period when the $NYAD is either moving higher or consolidating.
In this case, where one heavily-weighted stock brings the index down when the rest of the market continues to move higher, you would see a positive divergence, meaning that the market's breadth is better than what the cap-weighted price distortion indicates. The current market is displaying a positive divergence, which by definition is bullish.
The second reason is that algorithmic trading (bots) can further distort the action in the market on an intraday basis. This often happens when meme stocks attract money and the algos magnify the current trend as they pile on in order to grab quick profits.
In both cases, the $NYAD filters the price distortion because any single stock gets only one vote in this indicator. So, when $NYAD goes up or down, it's because most stocks are rising or falling, respectively. In other words, a rising $NYAD is a more meaningful indicator of an uptrend than a rising $SPX, where a handful of stocks can distort the index.
The reverse is also true. If $NYAD is falling and $SPX is rising, this is known as a negative divergence. Negative divergences often precede bear markets or meaningful declines.
Until something changes, this market is under the influence of a positive divergence, which is why I'm still leaning toward the bullish case. If the situation reverses, I will change my mind. More details on $NYAD and $SPX below.
Checklist Review on Bull vs. Bear Market
As I noted here last week, for the past several months in my weekly portfolio update to subscribers, I've noted that, when the following conditions are met, I would turn bullish. Here they are, with updates:
- The $NYAD moving well above its 200-day MA.
- A rally in the Eurodollar Index ($XED), which would mean liquidity has improved.
- The Cboe Volatility Index ($VIX) trading near its lows for a long time, which would mean that put buyers have mostly gone away, leaving the market makers no choice but to buy calls and index futures in order to hedge their bets.
- A clear sign from the Fed that the interest rate hike cycle is not just slowing, but coming to an end.
So here is where we stand at the moment. $NYAD and $VIX are still bullish. $XED is still moving sideways, which is essentially neutral. Meanwhile, the Fed is speaking out of both sides of its mouth, recently leaking that it would raise rates by only 25 basis points, while more recent Fed speakers are still talking about raising rates above 5%.
Putting it all together, we have two positives and one neutral. That means the environment for stocks is better than it was at the end of 2022 because the market's breadth is better and bears are less willing to buy put options, which eventually drive stock prices down. As long as liquidity remains stable, even if the Fed remains focused on raising rates, the market is more likely to grind higher than to fall. If any of these parameters change for the worse, the downtrend will resume.
Check out what's working with a Free trial to my service. Click here for more.
Buy Homebuilders Dip as Mortgage Rates Decline
Investors who are focused on the most recent housing data, which features rising inventories, falling home prices, dismal existing home sales and reports of homebuilders using gimmicks to sell their swelling inventories, aren't watching the bullish effects of falling mortgage rates on homebuilder and related stocks.
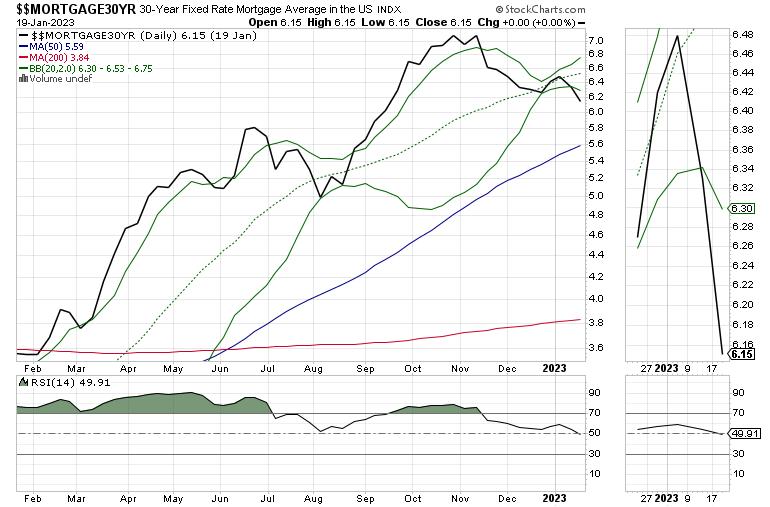
Last week, we saw the average 30-year mortgage rate drop to 6.15%. That's nearly a point below the late 2022 peak. Meanwhile, the data that's being reported is from December. On the ground, there's a pickup in activity. For the first time in several weeks, I'm seeing new housing being framed in new developments, along with the sale of lots for future builds. Moreover, I'm starting to see a trickle of traffic in some existing homes I keep an eye on as indicators. This suggests that the awful housing data will see some improvement in the next few months.
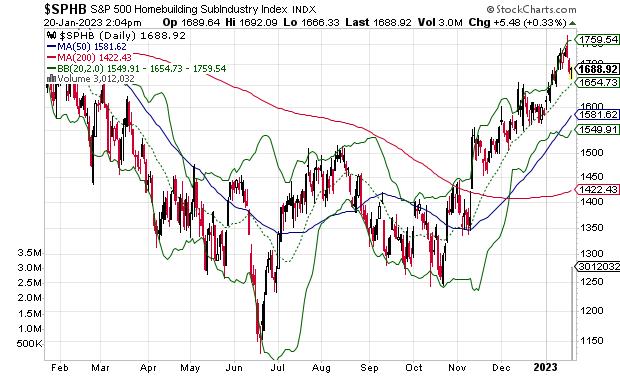
That means that the recent slight pullback in the S&P 500 Homebuilders Subindustry Index ($SPHB) is likely a buy-on-the-dip opportunity for those who have missed the rally from the October bottom.
If you're looking for ideas on which homebuilders to buy, take a free trial to my service here.
Bullish Development: NYAD Breaks Above 200-day MA and Makes New High
The $NYAD line has established itself above its 50-day and 200-day MAs on January 6, 2023. This puts the stock market in an uptrend.

For its part, the $VIX has failed to rise meaningfully, marking a significant change in the market's sentiment. This is also bullish. When $VIX rises, stocks tend to fall, as rising put volume is a sign that market makers are selling stock index futures in order to hedge their put sales to the public. A fall in $VIX is bullish as it means less put option buying, and it eventually leads to call buying, which causes market makers to hedge by buying stock index futures, raising the odds of higher stock prices.
Liquidity is flat, despite the Fed's QT maneuvers, as the Eurodollar Index ($XED) has been trending sideways to slightly higher for the past few weeks. Note the market's most recent rally, off the October bottom, has corresponded to this flattening out in liquidity.

The $SPX has found support at 3800–3900 three times in the last few days, and is now back above its 20-, 50-, and 200-day MAs, but closed just below the 4000 area. At the same time, the accumulation distribution line (ADI) has been steady, and on balance volume (OBV) has bottomed out while attempting to turn up. That means that there is now net buying in stocks, even if it's in spurts.
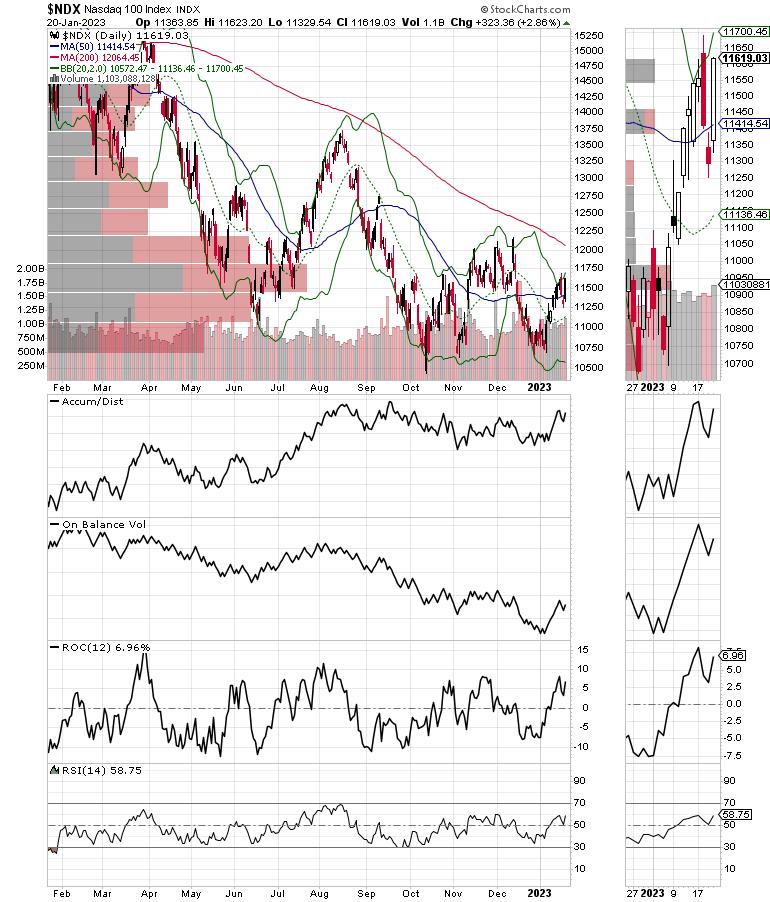
The Nasdaq 100 index ($NDX) has made a fairly concrete triple bottom, even as it continues to lag $SPX. It's still possible that it may have made a triple bottom with the 10,500–10,700 price area bringing in some short-covering. The index is now above 11,000, while the real test is what will happen at the 12,000 area and the 200-day moving average.
To get the latest up-to-date information on options trading, check out Options Trading for Dummies, now in its 4th Edition—Get Your Copy Now! Now also available in Audible audiobook format!
 #1 New Release on Options Trading!
Good news! I've made my NYAD-Complexity - Chaos chart (featured on my YD5 videos) and a few other favorites public. You can find them here.
Joe Duarte
In The Money Options
Joe Duarte is a former money manager, an active trader, and a widely recognized independent stock market analyst since 1987. He is author of eight investment books, including the best-selling Trading Options for Dummies, rated a TOP Options Book for 2018 by Benzinga.com and now in its third edition, plus The Everything Investing in Your 20s and 30s Book and six other trading books.
The Everything Investing in Your 20s and 30s Book is available at Amazon and Barnes and Noble. It has also been recommended as a Washington Post Color of Money Book of the Month.
To receive Joe's exclusive stock, option and ETF recommendations, in your mailbox every week visit https://joeduarteinthemoneyoptions.com/secure/order_email.asp.
