There are loud voices on Wall Street who continue to talk about bear markets. In my opinion, that's a good thing. That's because bull markets climb walls of worry, and the higher this rally goes, the more the bears seem to growl.
So are we in a new bull market? A lot depends on what happens after the dust clears on the employment numbers. If the dip buyers come back strong, the uptrend will continue.
Taking Stock
The S&P 500 index ($SPX) is up some 19% from the October bottom, near 3500, and is currently trading above its 200-day moving average. That means that, when the S&P 500 closes somewhere above 4200, it will meet the definition of a bull market. For now, even after the employment report pullback, we remain in an uptrend.
Doubters in the recent uptrend got yet another wakeup call when the Fed raised interest rates, as expected, and Fed Chairman Powell sounded as pragmatic as he possibly could in his press conference. As a result, the market rallied. By Friday, when the employment report surprised those expecting signs of weakening on the jobs front, the market again sold off. However, by day's end, there was no technical damage done to the market -- at least, not yet.
Of course, there are plenty of reasons to be concerned about the future. First and foremost, there is whatever is next in Ukraine. Closer to home, we have the Fed. And even though the central bank may slow the pace of its rate increases, Mr. Powell isn't likely to stop raising interest rates in the first half of the year. Still, private matter surveys such as PMI, ISM, consumer confidence, homebuilder sentiment, crashing home prices, layoff announcements, and similar data continue to suggest the economy is slowing.
The difference between government reports and private market data doesn't add up, for sure. Indeed, there are some analysts who suggest that the BLS numbers are too statistically jiggered to be believed at face value. In fact, a recent report by the Philadelphia Federal Reserve cast serious doubt on the BLS numbers.
Bull Markets Are for Dip Buyers
When the news whipsaws the market, it's important to focus on the general vibe of any market trend. For example, bear markets are unforgiving. Bad news is bad news. And good news is bad news. Rallies are often powerful but fizzle quickly. And the longer they last, the more investors become disillusioned.
Bull markets seem to find the silver lining, no matter what the news. Take, for instance, the recent Federal Reserve rate hike, which led to a rally. The silver lining was that the Fed raised interest rates by 25 basis points instead of 50 or 75 basis points. Moreover, bull markets are fueled by naysayers. Bearish analysts pound the table, calling for the end of the rally on a regular basis. Yet, it keeps going higher.
But perhaps the most salient feature of a bull market is the constant dip-buying behavior from investors. This is the mirror image of what you see in a bear market, where every rally is sold and new lows are a regular occurrence. So, the next test for this uptrend is whether, after the employment report pullback, the dip buyers reappear.
Trade What You See But Don't Trust the Market
Because we are in an uptrend, and perhaps in the early stages of a bull market, it pays to focus on what the price charts are saying and how the markets respond to news.
The bond market is torn over the notion that the Fed will cause a recession by over-tightening interest rates. That's why yields have dropped starting in October. At the same time, bond traders aren't sure about what the robust BLS jobs report means for the economy and what the Fed will do in response.
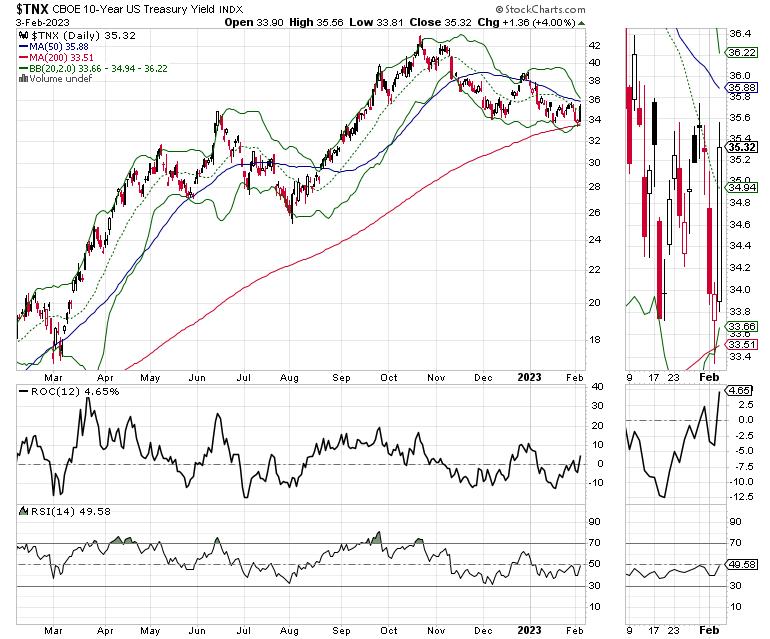
The 3.5% yield on the 10-Year U.S. Treasury Yield index ($TNX) seems to be a good floor for bond yields at the moment. Thus, what happens at this chart point is very important. If yields break below this level, it will likely be in response to a very credible piece of economic data—either on the inflation front or on the employment front—that the economy is increasingly weak. An even more important point is the 50-day moving average. A move above that for the 10-Year yield would be a negative sign.
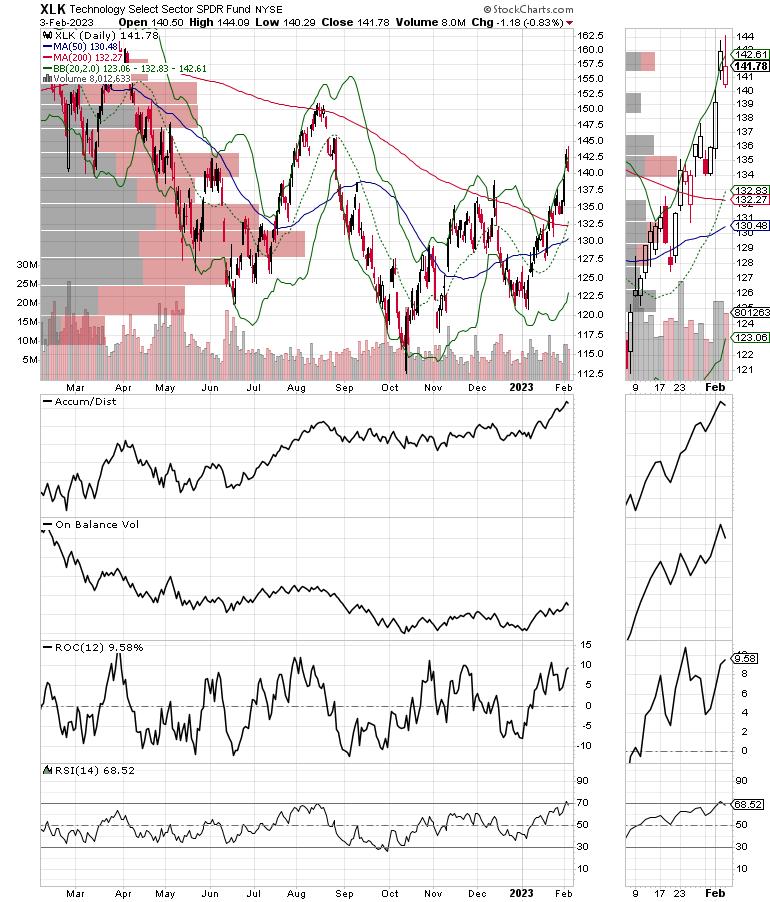
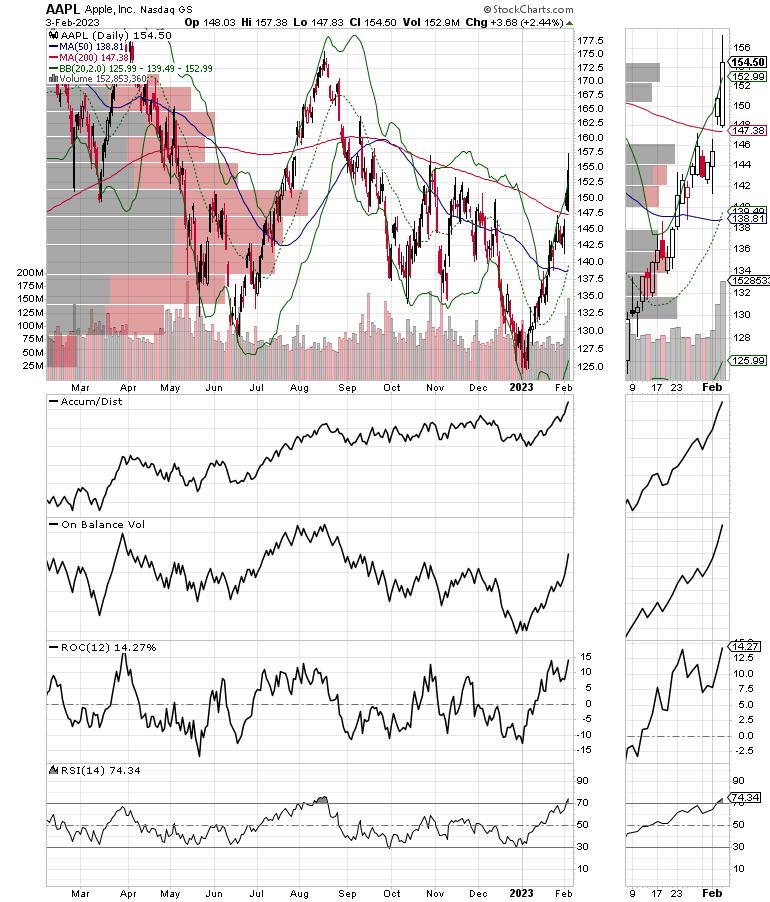
On the other hand, certain areas of the technology sector continue to power higher despite bad earnings misses from Amazon (AMZN), Alphabet (GOOGL), and, recently, Microsoft (MSFT). The strength has come from the semiconductor sector, and companies like Apple (AAPL) have managed to convince traders that the worst may be passed.
The bottom line is that focusing on what's working while keeping an eye on how the markets respond to the news, is likely to be the best strategy for the rest of 2023.
I have plenty of picks that are working in the current market; check them out with a free trial here.
Uptrend Remains Intact: NYAD, SPX, and NDX All Hold Above 200-Day Moving Average
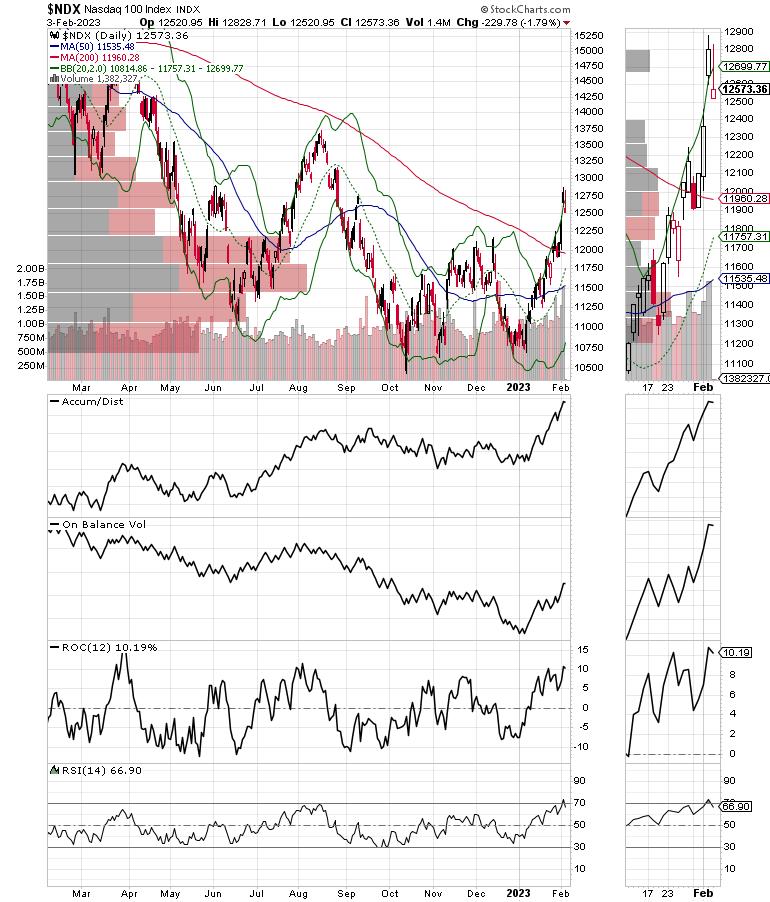
The Nasdaq 100 Index ($NDX) has moved too fast and has gotten ahead of itself over the last few days. On February 3, 2023, it closed above the upper Bollinger Band®, which is usually a sign that a reversal or a consolidation is due. A move back toward the 200-day moving average and the 12,000 level may not be out of the question. A break below the 200-day moving average would be very negative. For now, we are seeing normal technical behavior.
On the bullish side, note the upturn in on balance volume (OBV) as the accumulation distribution line accelerates. This combination of indicators highlights an increase in short sellers bailing out (ADI) and buyers coming in (OBV).
The New York Stock Exchange Advance Decline line ($NYAD) reversed its recent uptrend at the same resistance level in which it reversed in August 2022. The major difference is that this reversal has occurred above the 200-day moving average. A move back to the 20-day moving average would not be unexpected here.
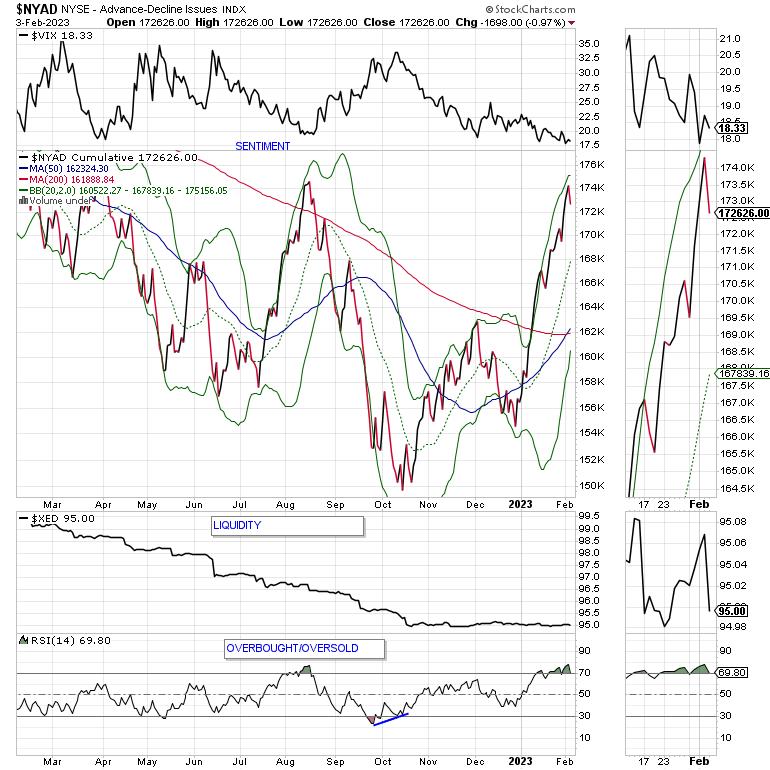
Meanwhile, the CBOE Volatility Index ($VIX) is barely moving, which is a bullish sign. The index continues to make new lows, which is also bullish. When VIX rises, stocks tend to fall as put volume rises. It gives us a sign that market makers are selling stock index futures to hedge their put sales to the public. A fall in VIX is bullish, as it means less put option buying and eventually leads to call buying, which causes market makers to hedge by buying stock index futures, raising the odds of higher stock prices.
Get all the details on why my favorite indicator, the NYAD, is bullish on the market right here.
Liquidity, the market's lifeblood, remains flat, which is better than when it's falling, as the Eurodollar Index ($XED) has been trending sideways to slightly higher for the past few weeks. Note the market's most recent rally, off of the October bottom, has corresponded to this flattening-out in liquidity. Note how the continuous decline in the Eurodollar Index corresponded to the bear trend in 2022.
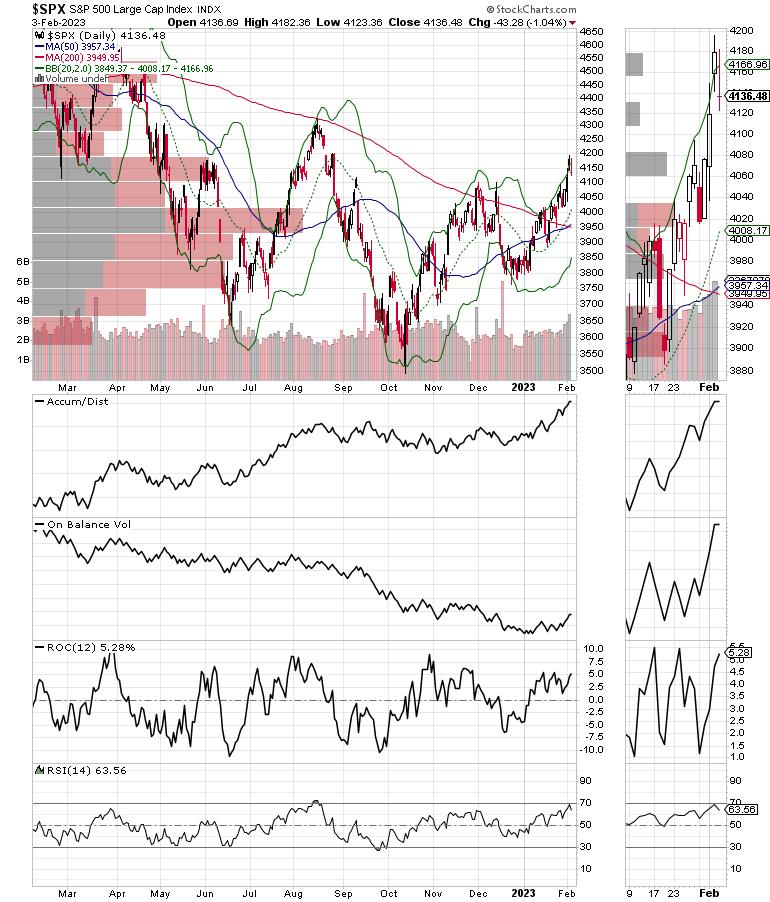
The S&P 500 index ($SPX) remained above 4100, having now moved fairly decisively above its 20-, 50-, and 200-day moving averages. A move above 4200 would be a 20% move off of the October 2022 bottom.
As with NDX, the Accumulation/Distribution (ADI) On Balance Volume (OBV) combination suggests money continues to flow into stocks.
To get the latest up-to-date information on options trading, check out Options Trading for Dummies, now in its 4th Edition—Get Your Copy Now! Now also available in Audible audiobook format!
 #1 New Release on Options Trading!
Good news! I've made my NYAD-Complexity - Chaos chart (featured on my YD5 videos) and a few other favorites public. You can find them here.
Joe Duarte
In The Money Options
Joe Duarte is a former money manager, an active trader, and a widely recognized independent stock market analyst since 1987. He is author of eight investment books, including the best-selling Trading Options for Dummies, rated a TOP Options Book for 2018 by Benzinga.com and now in its third edition, plus The Everything Investing in Your 20s and 30s Book and six other trading books.
The Everything Investing in Your 20s and 30s Book is available at Amazon and Barnes and Noble. It has also been recommended as a Washington Post Color of Money Book of the Month.
To receive Joe's exclusive stock, option and ETF recommendations, in your mailbox every week visit https://joeduarteinthemoneyoptions.com/secure/order_email.asp.
