The bears are getting louder as stocks consolidate recent gains. But the market's current price consolidation behavior, until proven otherwise, is quite normal, especially after a nearly 20% rally in the S&P 500 index ($SPX) since the October 2022 bottom. That said, if enough buyers don't materialize fairly soon, we could see a more serious pullback in stocks as the month of February develops.
Certainly, the upcoming consumer price index (CPI) release could well set the stage for more selling. But no matter whether the market is rising or falling, the major reason for changes in stock prices is what happens inside the server farms which house the stock market. That's because that's where the machine traders who move the market ply their wares.
Because it's important for all investors to be fully aware of this, in this article, I will delve into how this process works in some detail.
For what it's worth, I wouldn't be surprised to see another flat or even another softer-than-expected monthly reading on CPI. Moreover, if that's the way things work out, it would give bond traders another chance to drop yields, which would likely re-ignite the rally in stocks.
The Self-Perpetuating Loop: Humans Have Doubts. Robots Just Follow the Program.
The problem with human investors is that doubt is a constant companion. Meanwhile, trading robots (algos) just follow their programmed instructions—"if this happens, do this." Thus, while it is plausible that the current rally may stall, in that case, human traders will throw up their hands, CNBC will freak out, and the pundits will talk endlessly as to why this happened. Rest assured, the algos won't fret. They will just trade.
Over the years, I've learned that in some ways, mimicking the algos is better for my mental health as a trader than trying to figure out what's happening in the world. So, I've learned to structure my trading based on the same rules that govern the algos' "if this happens, do this" world, where the only things that matter are order flow, support, and resistance.
Order flow, of course, refers to what the market maker bots see before every trade gets executed; a preponderance of buyers or sellers. Over time, the order flow becomes a trend that's magnified by what non-market maker bots do based on price behavior at key support or resistance levels in the market.
For example, during periods in which sell orders outnumber buy orders, market maker algos lower bid/ask prices by executing lower priced trades. Meanwhile, they sell put options to bearish traders and sell stock index futures to hedge their own accounts. This combination of orders from traders and market makers serves to drive prices lower.
Think of an algo as an accommodating bartender/host, always there to give the customers what they want. When algos see more sellers than buyers, their programming instructs them to sell and hedge the downside, no questions asked. This causes the market to fall. When algos see a preponderance of buy orders, they sell stocks to buyers and hedge accordingly—selling call options and buying stock index futures. This causes the market to go up. No matter what the situation is, the algos are there to serve the majority of the orders. And unlike some bartenders, algos never tell the customers when they've had enough and call a cab. Instead, they wait for the order flow to turn and repeat their time-tested money-making maneuvers.
In contrast, human traders fret over whether price changes are meaningful or not. Their indecision often clouds their judgment, and they often miss meaningful clues as to what's really happening. At its worst, this human frailty causes terrible things to happen, such as panic buying at important market tops, or bailing out at what turns out to be the market bottom.
My point in bringing this up is that the best way to see what the algos are doing is to concentrate on price charts. That's because price charts filter out the doubt and the emotion that goes along with trading. So, while what happens in the world matters to me as a person, when I put on my trader's hat (I've really got one), I try to shut out all the noise and focus on "if this happens do this." Because in the market, what the algos do in response to the way the order flow reacts to support and resistance levels is what really matters.
The Big Picture and VBP
Everyone's portfolio reacts differently to market conditions. But if you're an active trader with an intermediate-term timeframe, you've seen a consolidation in your portfolio's net value of late.
You shouldn't be surprised.
The S&P 500 index is up some quite a bit since the October bottom, and it's due for a pause. What's important, especially because the non-market maker bots are looking at this, is that the S&P 500 is trading above its 50- and 200-day moving averages. Moreover, it's trading inside the key support level band of 4050–4100. You can see the full details on the S&P 500 and the rest of the market below.
By the same token, the rally stalled right below 4200, which roughly corresponds to a 20% gain from the October bottom. Closer inspection of the S&P 500 index bar also shows that there is a large Volume-by-Price (VBP) bar on the left of the chart, whose top is just below 4200.
VBP is an underappreciated indicator. Yet its usefulness is immense, because it quantifies the trading crowd's interest in a price level. In other words, the bigger the bar, the more important the price level as a support/resistance level, because that's an area where buyers are buying and sellers are selling aggressively. The larger the bar, the more important the price area.
Pay special attention to the three VBP bars on the $SPX chart below as they are located between 4050 and 4200. That's not a coincidence. That's where the bulls and the bears are fighting for the market's next direction. You know that the algos are paying attention to the order flow in this price range. The bots know this, so many of their decisions (if this happens do this instructions) are based on VBP bars. What that means is that when prices break above or below a VBP bar, that price trend has an excellent chance of continuing.
Again, that's because the bots pile on with their pre-programmed orders when prices break above or below these key price areas. Just as important is what happens when prices break below a major VBP level.
And remember. Bots have no doubts. They just follow their instructions. That means that human opinions, including mine, about whether we're in a bull market or not don't really matter. Only price action does. And price action is mostly influenced by order flows, support, resistance, and the "if this happens do this" instructions that rule the bots.
Bond Yields Ripe for Reversal
U.S. Treasury bond yields have risen lately, with the 10-Year U.S. Treasury Yield Index ($TNX) moving close to 3.75%. This has been a negative on stocks.
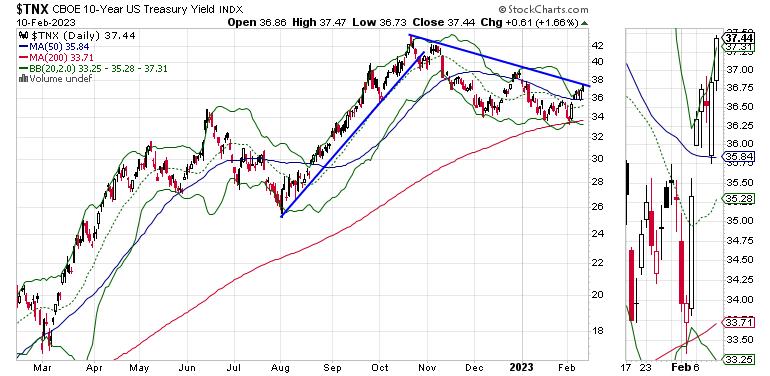
But $TNX has now risen above its upper Bollinger Band®, which means that it's ripe for a pullback toward the 50- and 20-day moving averages, which are just above 3.5%. In addition, $TNX is also up against a trendline that goes back to the 2022 top in yields. A more crucial level is the 3.4% yield, which is the 200-day moving average. That means that next week could be decisive for bonds. And that means that a pleasant surprise in CPI could well reignite the rally in both bonds and stocks.
I have plenty of picks that are working in the current market, plus a growing shopping list that I will deploy when the time is right. Check them out with a free trial here.
Support Holds for Now: NYAD, SPX, and NDX All Hold Above 20-Day Moving Average
The New York Stock Exchange Advance Decline line ($NYAD) found support at its 20-day moving average after it had previously reversed its recent uptrend at the same resistance level at which it reversed in August 2022. So far, despite the general handwringing out there, this is normal technical behavior.

The Nasdaq 100 Index ($NDX) found support at the 12,200 area and above its 20-day moving average, which means the uptrend remains intact. A move below the 200-day moving average would be negative.

The bottom line is that focusing on what's working while keeping an eye on how the markets respond to news is likely to be the best strategy for the rest of 2023.
I have plenty of picks that are working in the current market. Check them out with a free trial here.
Uptrend Remains Intact: NYAD, SPX, and NDX All Hold Above 200-day Moving Average
The Nasdaq 100 Index (NDX) has moved too fast and has gotten ahead of itself over the last few days. On 2/3/23 it closed above the upper Bollinger Band, which is usually a sign that a reversal or a consolidation is due. A move back toward the 200-day moving average and the 12,000 may not be out of the question. A break below the 200-day moving average would be very negative. For now, we are seeing normal technical behavior.
On the bullish side note the upturn in On Balance Volume (OBV) as Accumulation Distribution (ADI) accelerates. This combination of indicators highlights an increase in short sellers bailing out (ADI) and buyers coming in (OBV).

Meanwhile, the Cboe Volatility Index ($VIX) has moved back above 20, with stout resistance at 22.50. When VIX rises, stocks tend to fall as rising put volume is a sign that market makers are selling stock index futures in order to hedge their put sales to the public. A fall in VIX is bullish, as it means less put option buying, and it eventually leads to call buying. This causes market makers to hedge by buying stock index futures, raising the odds of higher stock prices.
Get all the details on why my favorite indicator, the $NYAD, is bullish on the market on Your Daily Five right here.
Liquidity, the market's lifeblood may have also found a bottom after the recent slide, as the Eurodollar Index ($XED) closed near 95 on February 10, 2023. Note the market's most recent rally, off of the October bottom, has corresponded to this flattening out in liquidity. Also note how the continuous decline in $XED corresponded to the bear trend in 2022.

The S&P 500 fell below 4100 but remained above 4050 and its 20-, 50-, and 200-day moving averages. A move above 4200 would be a 20% move off of the October 2022 bottom. A move below the 20- and 50-day averages would likely set up a test of the 200-day line.
As with $NDX, the Accumulation/Distribution (ADI) On Balance Volume (OBV) combination suggests money continues to flow into stocks.
To get the latest up-to-date information on options trading, check out Options Trading for Dummies, now in its 4th Edition—Get Your Copy Now! Now also available in Audible audiobook format!
 #1 New Release on Options Trading!
Good news! I've made my NYAD-Complexity - Chaos chart (featured on my YD5 videos) and a few other favorites public. You can find them here.
Joe Duarte
In The Money Options
Joe Duarte is a former money manager, an active trader, and a widely recognized independent stock market analyst since 1987. He is author of eight investment books, including the best-selling Trading Options for Dummies, rated a TOP Options Book for 2018 by Benzinga.com and now in its third edition, plus The Everything Investing in Your 20s and 30s Book and six other trading books.
The Everything Investing in Your 20s and 30s Book is available at Amazon and Barnes and Noble. It has also been recommended as a Washington Post Color of Money Book of the Month.
To receive Joe's exclusive stock, option and ETF recommendations, in your mailbox every week visit https://joeduarteinthemoneyoptions.com/secure/order_email.asp.
