
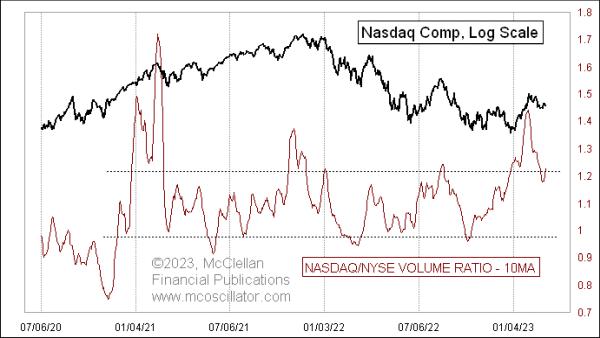
The ratio of total Nasdaq volume to total NYSE volume can be used as a decent sentiment indicator for the stock market. It is not without its problems, though, so one can learn to deal with its vagaries.
This week's chart shows that ratio, smoothed with a 10-day simple moving average to see past the noise in the data. It correlates pretty nicely with the movements of the Nasdaq Composite Index. When it gets up to a high level, it helps to mark a top, especially at the moment when it turns down from that high level. And low levels help to mark nice price bottoms. The current level is still up pretty high, and so the immediate conclusion is that falling prices have not yet done enough work on sentiment yet to show us a nice bottoming condition for stock prices.
Nasdaq stocks tend to be more speculative, in part because of the easier listing standards there, and in part because of tradition concerning the types of companies that choose to list there versus the NYSE. So, when traders are feeling more frisky, they like to trade Nasdaq stocks more, driving up the total volume on that exchange. And when prices have fallen, meaning people retreat back into trader hibernation, the Nasdaq market's total volume falls in comparison to the NYSE. This is all a nice neat story, and viewing these readings in the context of the recent range of values works for the past two and a half years.
It becomes a problem, though, when we look back farther in time. There was a big change that began after the COVID Crash in March 2020, when free money and people trading while working from home boosted the volume in low-priced stocks. Share volume is not all the same, and the same amount of money invested in low-priced stocks results in more numerical shares traded. That helped to boost this Nasdaq/NYSE Volume Ratio up to a seemingly permanent new high range of values.
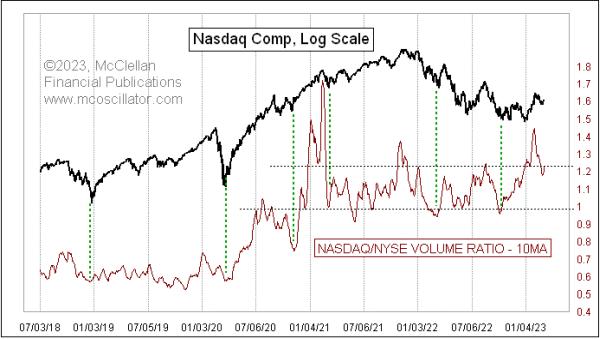
Therein lies the problem. If you are going to use this or any indicator to gauge when a "high" or "low" reading offers us a sentiment indication, then you need to have a way of determining what "high" and "low" readings mean. That is problematic when data go through a huge regime change, and levels that used to be good markers of an overbought condition get ignored. That is a big problem. And I do not know of a good way to know that such a regime change in "normal" levels is taking place as it is happening. After the fact is a much better way to make such determinations, but we don't get to trade that way.
With those caveats out of the way, I still think it is fair for the moment to note that this Nasdaq/NYSE Volume Ratio is still up pretty high, meaning that this is not one of those juicy bottoming opportunities. Not yet. A bit more work needs to be done by the market to convince everyone that all hope is lost, that trading penny stocks is a foolish idea (it always is, but people still believe), and, when that has happened, then we can have the opportunity for a meaningful up move.