
Despite the gloom and doom and increased volatility, money seems to be moving into the stock market.
On the surface, there is high anxiety in the markets. Certainly, the potential for more problems in banking remains well above average, as rumors surfaced late in the week suggesting Deutsche Bank (DB) may become the next European bank to fail. And although the banking crisis has overshadowed the problems in commercial real estate, there hasn't been a resolution to that issue either. All of this adds up to what may be driving the stealth positive money flows into stocks; expectations that the Fed is done raising rates.
Dueling Messengers and Unintended Consequences
It doesn't get much stranger than this. On March 22, 2023, after the Federal Reserve raised interest rates by a quarter of a point as expected, Chairman Jerome Powell, during his presser, was able (for once) to keep the stock market from unraveling, as it often does when he speaks. Unfortunately, Treasury Secretary Janet Yellen did the job for Mr. Powell when she testified in front of the US Senate and noted that there were no plans to increase deposit insurance funds to alleviate the banking crisis.
So while Powell's press conference was reassuring, Yellen's unexpected remarks triggered a 500+ point loss for the Dow Jones Industrial Average ($INDU), which spread throughout the market.
Interestingly, the treasury secretary reversed her comments on the following day. But the market's message was clear, as the price chart for the KBW Bank Index ($BKX) shows.
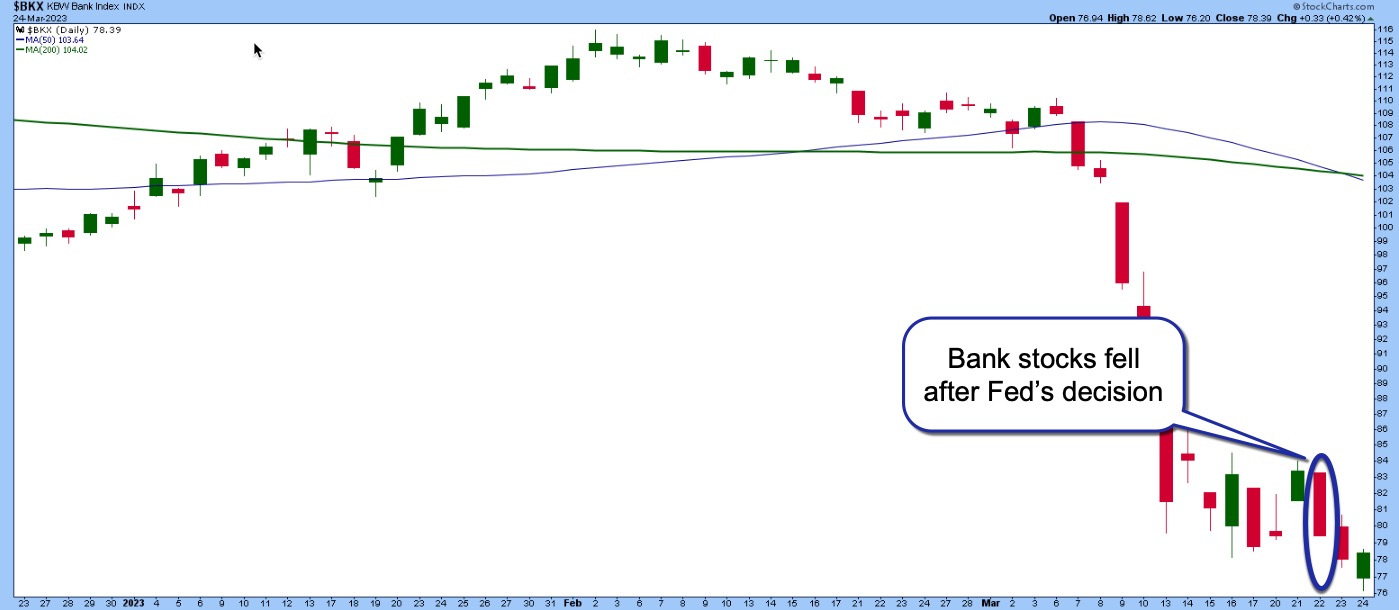
CHART 1: KBW BANK INDEX ($BKX) GOT HIT HARD. The recent banking crisis and comments from the Fed hurt the banking sector. $BKX fell sharply and is well below its 200-day moving average. Chart source: StockCharts.com. For illustrative purposes only.
But one sector's losses can create gains for others, which is what seems to be happening with homebuilders and technology stocks being the beneficiaries.
Bond Yields Tumble as Traders Factor in Recession Odds and Fed Easing
The stock market grabs the headlines, but the action in the bond market suggests that traders are increasingly betting on a recession and a Federal Reserve easing of rates in the US. The 10-Year US Treasury Index ($TNX) failed in its most recent attempt to rebound and, by week's end, was back below 3.5%.
This decline in yields will be felt throughout the economy as related commercial rates (mortgages, auto loans) will follow. This is already evident in the housing market, as potential homebuyers have quickly reacted to falling mortgage rates.
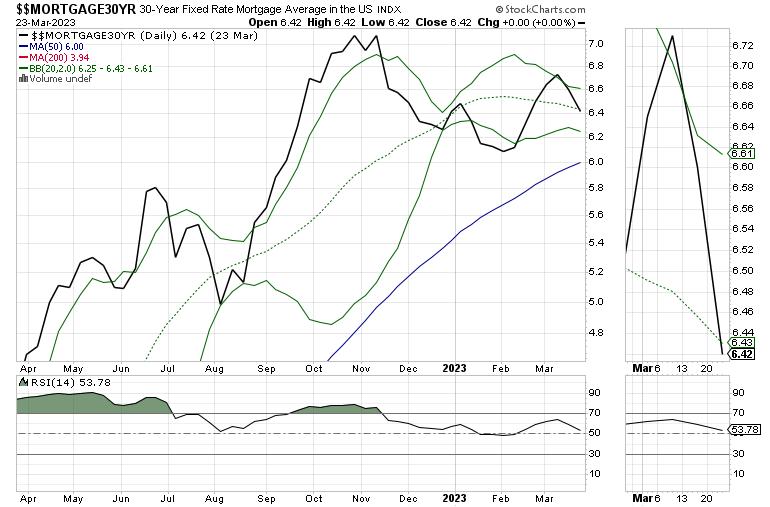
CHART 2: 30-YEAR MORTGAGE RATES. Falling Treasury yields will likely bring mortgage rates lower. This could boost homebuilder stocks. Chart source: StockCharts.com. For illustrative purposes only.
News Travels Fast: Existing Home Sales Surge as Mortgage Rates Fall
As I often write when describing the MELA system, news travels fast. That's because most people are connected to the news cycle. Thus, when bond yields fell in December 2022, potential home buyers who had been on the fence took the plunge, which led to an increase in existing home sales two months later. Here are the details:
- South region. Sales in the South were the strongest. Overall, sales rebounded 15.9% in February from January to an annual rate of 2.11 million, a 21.3% decrease from the prior year. The median price in the South was $342,000, an increase of 2.7% from one year ago.
- Midwest region. Sales here were next, with a 13.5% increase from the previous month to an annual rate of 1.09 million in February, declining 18.7% from one year ago. The median price in the Midwest was $261,200, up 5.0% from February 2022.
- West region. Existing-home sales rose 19.4% in February from the prior month to an annual rate of 860,000, down 28.3% from the previous year. The median price in the West was $541,100, down 5.6% from February 2022.
- Northeast region. US sales improved by 4% from January to an annual rate of 520,000 in February, down 25.7% from February 2022. The median price in the Northeast was $366,100, down 4.5% from the previous year.
As you can see, the general regional trends continue, with prices remaining stable or rising in the South and the Midwest while falling in the Northeast and West. The number of houses sold in the South also continues to outpace the other three regions as the Great Migration continues.
I discussed the long-term investment potential in homebuilder stocks in my latest Your Daily Five video, focused on investing in Megatrends.
Homebuilder Megatrend Remains Intact
Homebuilder stocks continue to show significant relative strength. This strength is supported by field observation. In my own neck of the woods, the Dallas-Fort Worth area, the recent decline in mortgage rates has brought buyers off of the sidelines. A newly constructed townhome development near where I live had three vacant homes for the past two months as rates rose. Now, as rates have dropped, they are all under contract.
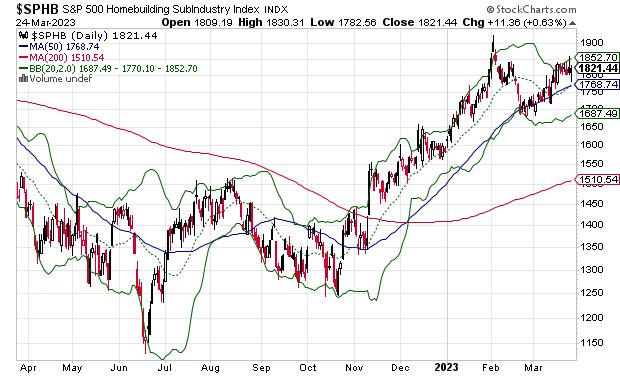
CHART 3: HOMEBUILDERS COULD SHOW STRENGTH. As mortgage rates drop, keep an eye on homebuilder stocks. They could see an upward move. Chart source: StockCharts.com. For illustrative purposes only.
Other developments in the neighborhood and surrounding areas are also showing signs of rising activity as well. And the number of out-of-state license plates I see on my commute remains high.
Homebuilder stocks are core holdings at Joe Duarte in the Money Options. Check them out with a free trial of my service here.
Technology Stocks are Stealth Money Magnets
Just as homebuilders are in a good position, the technology sector is also gathering interest. The Van Eck Semiconductor ETF (SMH) is tracing a bullish trading pattern as investors focus their interest on longer-term issues, such as the re-shoring of chip factories to the US and the potentially positive effects of those moves on the US economy.
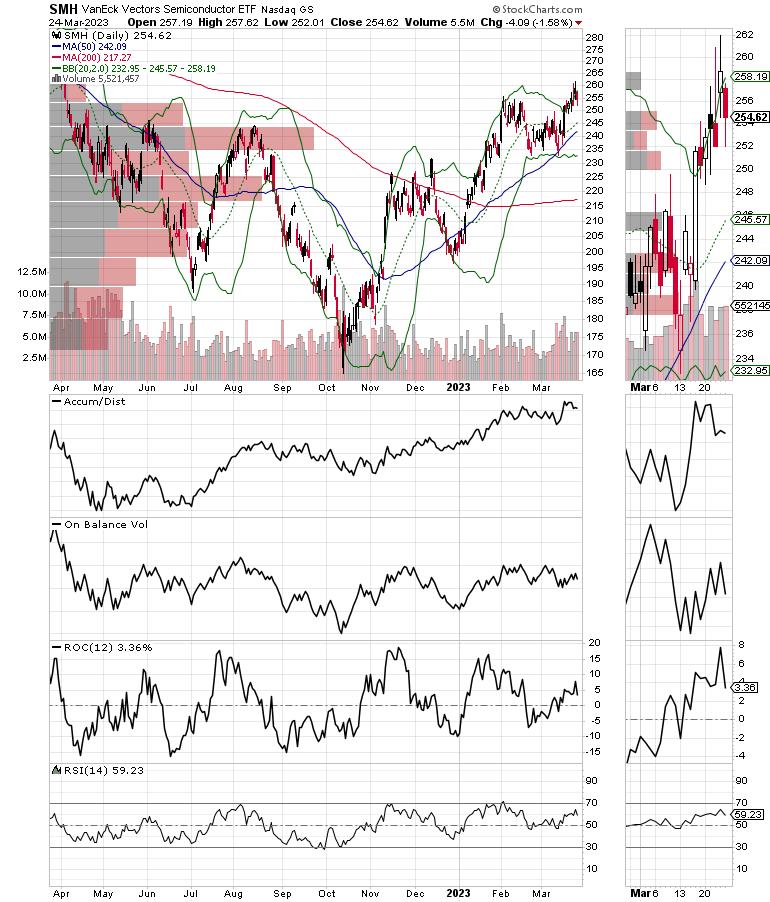
CHART 4: CHIPS TALLY ON. Price action in the Van Eck Semiconductor ETF (SMH) indicates investors have shifted their focus on this subsector. Chart source: StockCharts.com. For illustrative purposes only.
Moreover, the continued expansion of data centers and communications-related activity is bullish for the chip sector, as servers, routers, switches, and related infrastructure are all powered by semiconductors. Note the bullish action in the price chart SMH, accompanied by a steadying of both Accumulation Distribution Line (ADI) and On Balance Volume (OBV).
Aside from the homebuilder and semiconductor sectors, other areas of the stock market bear watching. I recently posted commentary on one key area which is being ignored by most investors on my Buy me a Coffee page.
Bullish Money Flows are Taking Hold
Aside from the positive sector dynamics discussed above, the technical environment for stocks seems to be stabilizing following the prior week's banking crisis-related negativity. The New York Stock Exchange Advance Decline line ($NYAD) held just below the 200-day moving average, a key support level.
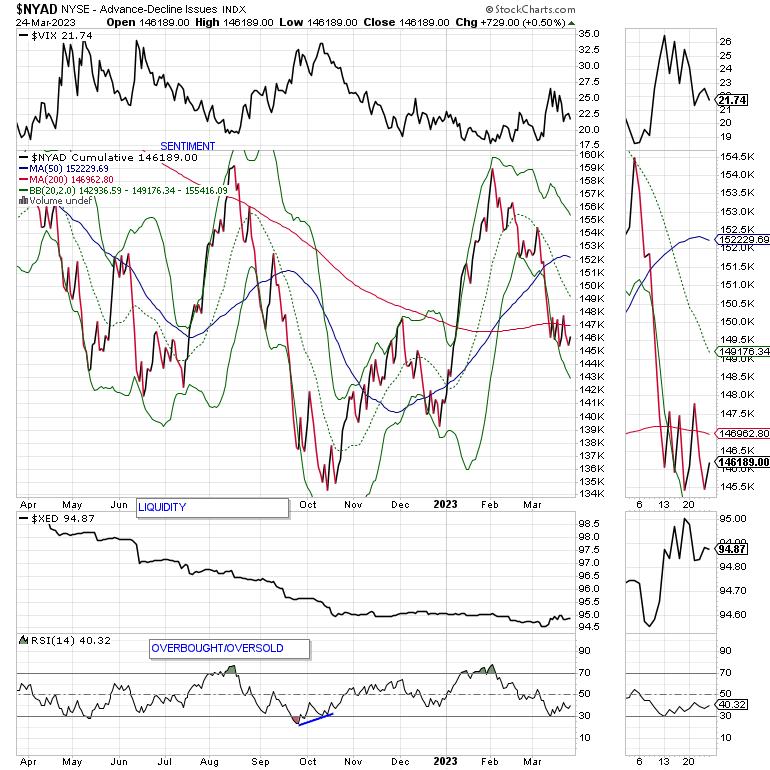
CHART 5: KEEP AN EYE ON MARKET BREADTH. The NYSE Advance-Decline line is just below its 200-day moving average. A break above it could mean bullish inflows into the stock market. Chart source: StockCharts.com. For illustrative purposes only.
Meanwhile, the S&P 500 ($SPX) remained above its 200-day moving average. On Balance Volume (OBV) and Accumulation Distribution (ADI) are starting to turn up on the S&P 500, which is very bullish if it continues.
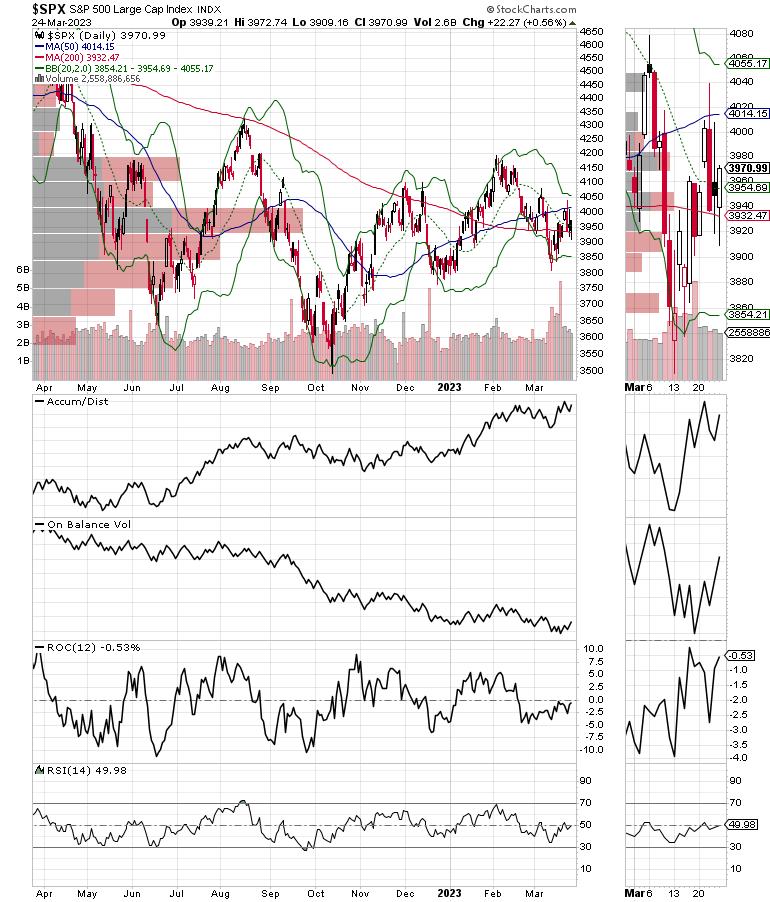
CHART 6: S&P 500 LOOKING BULLISH. The A-D line and OBV are turning up, which is a bullish sign. Chart source: StockCharts.com. For illustrative purposes only.
For its part, the Nasdaq 100 Index ($NDX) continued to outperform the S&P 500 as money flowed into technology companies. As in the chart of the S&P 500 above, there's a bullish uptick in the ADI and OBV as short sellers bug out, and buyers start moving in.
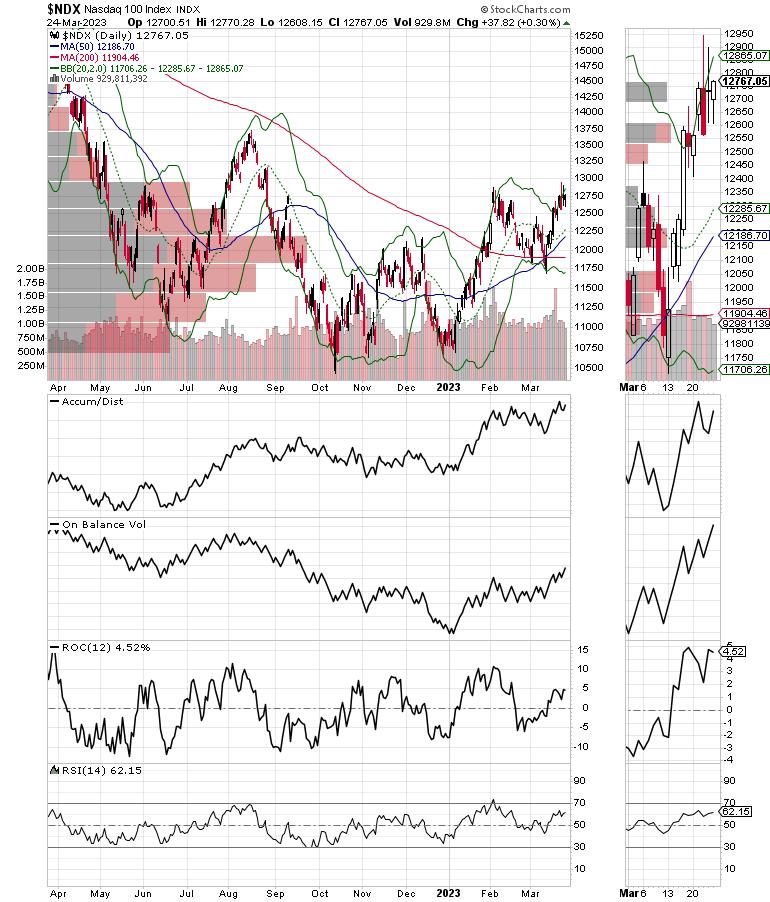
CHART 7: TECHNOLOGY LOOKS STRONG. Bullish uptick in the A-D line and OBV on the $NDX is positive for tech stocks. Chart source: StockCharts.com. For illustrative purposes only.
The Cboe Volatility Index ($VIX) also rolled over, suggesting that bearish sentiment is decreasing.
When VIX rises, stocks tend to fall as put volume rises; that's a sign that market makers are selling stock index futures to hedge their put sales to the public. A fall in VIX is bullish as it means less put option buying, and it eventually leads to call buying, which causes market makers to hedge by buying stock index futures, raising the odds of higher stock prices.
Most importantly, the market's liquidity also improved, as the Eurodollar Index ($XED) remained above support between 94.5 and 94.75. A move above 95 will be a bullish development for sure. Usually, a stable or rising XED is very bullish for stocks. On the other hand, in the current environment, it's more of a sign that fear is rising and investors are raising cash.
You can learn more about how to gauge the market's liquidity in this Your Daily Five video.
To get the latest up-to-date information on options trading, check out Options Trading for Dummies, now in its 4th Edition—Get Your Copy Now! Now also available in Audible audiobook format!
 #1 New Release on Options Trading!
Good news! I've made my NYAD-Complexity - Chaos chart (featured on my YD5 videos) and a few other favorites public. You can find them here.
Joe Duarte
In The Money Options
Joe Duarte is a former money manager, an active trader, and a widely recognized independent stock market analyst since 1987. He is author of eight investment books, including the best-selling Trading Options for Dummies, rated a TOP Options Book for 2018 by Benzinga.com and now in its third edition, plus The Everything Investing in Your 20s and 30s Book and six other trading books.
The Everything Investing in Your 20s and 30s Book is available at Amazon and Barnes and Noble. It has also been recommended as a Washington Post Color of Money Book of the Month.
To receive Joe's exclusive stock, option and ETF recommendations, in your mailbox every week visit https://joeduarteinthemoneyoptions.com/secure/order_email.asp.
