As the mainstream focuses on negative developments, such as the Fed's latest utterings and the implosion of subsets of the commercial real estate (CRE) sector, there seems to be a stealthy migration of money into other select areas of the market. This is a great example of why focusing on the markets instead of the external noise is the best way to trade.
Trade What You See
There's an old saying among wise veteran traders: "trade what you see." And the current market is a perfect place in which this adage holds up.
As investors await the Fed's nearly certain rate increase on May 3rd, the daily options market-related gyrations in stocks continue to develop. Meanwhile, the four-prong post-COVID pandemic megatrend continues to evolve, as I discuss in detail in my latest Your Daily Five video. Said megatrend is composed of:
- The Great Migration – population shifts to suburbs, rural areas, and the sunbelt;
- The CRE Implosion from an oversupply of office space;
- Bullish Supply Dynamics for Homebuilders; and
- The Evolving End of Globalization.
As a result, the only solution is to be contrarian, to trade what you see, and to focus on investments from a longer-term viewpoint. Stated plainly, if a stock is not crashing and the underlying business is performing reasonably well, then it's a keeper until proven otherwise.
Even better, as I detail below, detecting trend changes early is very helpful.
The Evolution of the Commercial Real Estate Crash
There is more nuance than what meets the mainstream eye going on in the beleaguered CRE market.
For example, the big news of the week was Vornado's (NYSE: VNO) dividend cut, which sent the shares lower as investors braced for worse news, such as the possibility of loan defaults. If that happens, few would be surprised.
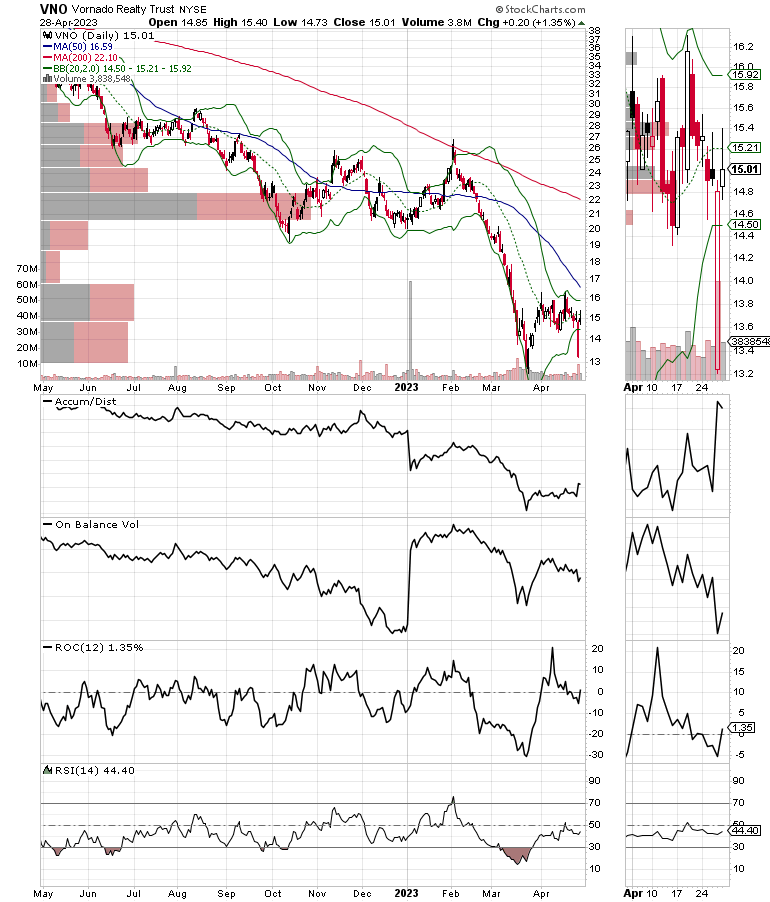
The price chart's Accumulation Distribution (ADI) shows that short sellers have had a field day with the shares over the past twelve months, especially during the last quarter. On Balance Volume (OBV) also indicates more sellers than buyers have been the norm of late.
But things may be changing in other areas of the real estate business. And a closer look at VNO's shares shows that the one day mini-crash in the stock on 4/27/23 was followed by a bounce which, of course, was short-covering.
As I described in my recent Your Daily Five video, the evolution of the post-pandemic megatrend is evolving into a new and quite investable phase. That's because the market is slowly adapting to its circumstances as businesses adjust to the changing landscape. And as one section of the real estate investment trust (REIT) world is suffering, other areas are starting to show signs of life.
To be specific, REITs, which are heavily laden with office building properties that are having trouble paying their bills. Loan defaults are becoming quite common; foreclosures and bankruptcies are likely to rise. On the other hand, those REITs who derive their income from residential properties are faring better. The result is an unexpected improvement in the price chart for the iShares U.S. Real Estate ETF (IYR).
The price chart for IYR shows that the entire sector still has plenty of work to do. But amazingly, REITs may have bottomed out. All of which suggests that the stock market may be starting to quietly price in a pause in the Fed's interest-raising cycle after the almost-certain rate increase, which is expected on May 3.
IYR's Accumulation/Distribution indicator (ADI) suggests that short sellers may have lost their enthusiasm for the sector. On the other hand, On Balance Volume (OBV) is still bottoming out, which suggests that buyers have not overwhelmed sellers altogether.
Still, the ETF is trading tightly near the $84 area, where there is a large Volume by Price bar (VBP). If the price can move above this key price point, we are likely to see a challenge of the 200-day moving average.
A move above that would be bullish. I have just added two long REIT plays to my portfolio. Get the details with a free trial to my service here.
Bond Yields Turn Lower at 3.5%. Home Buyers Play Cat and Mouse with Mortgage Rates.
The bond market continues to price in a slowing of the economy, while homebuyers continue to play a nifty game of cat and mouse as they try to time the mortgage market. Homebuilder stocks continue to move higher.
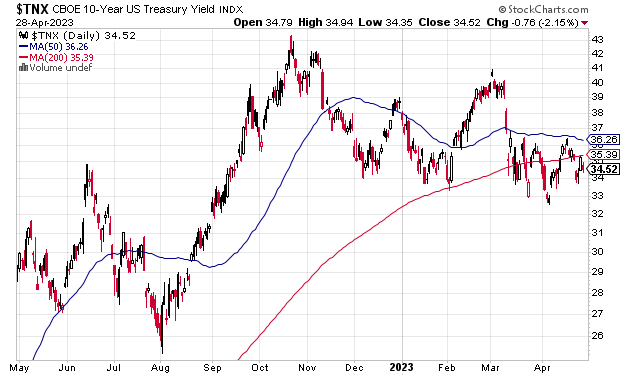
Over the last few weeks, the Fed hinted that another rate increase was coming at its May 2-3 FOMC meeting. Initially, this bearish talk pushed the U.S. Ten Year Note (TNX) despite above the 3.5% yield area. This resulted in a rise of the 30-year mortgage to 6.4%, where it has remained for the last couple of weeks.
This upside reversal delivered a slowing in existing home sales. But the reversal in bond yields on the week ended on 4/28 is likely to lead to yet another reversal in mortgage rates. Moreover, savvy potential homebuyers are likely calling their bankers as I write in order to lock in rates before the official numbers are released next week.
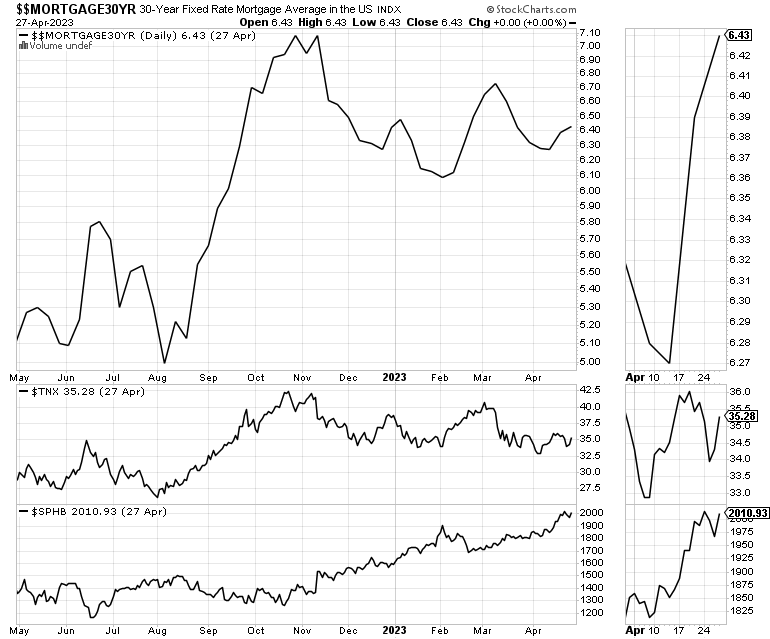
Note the close relationship between TNX, mortgage rates, and the steady uptrend in the homebuilder sector (SPHB). Specifically, take a look at the rally in SPHB, which was spawned when the average mortgage rate topped out in late 2022 above 7%. The subsequent decline in mortgages has been a boon for homebuilders.
For an in-depth comprehensive outlook on the homebuilder sector, click here.
NYAD Seems to Have Nine-Lives. NDX Breaks Out.
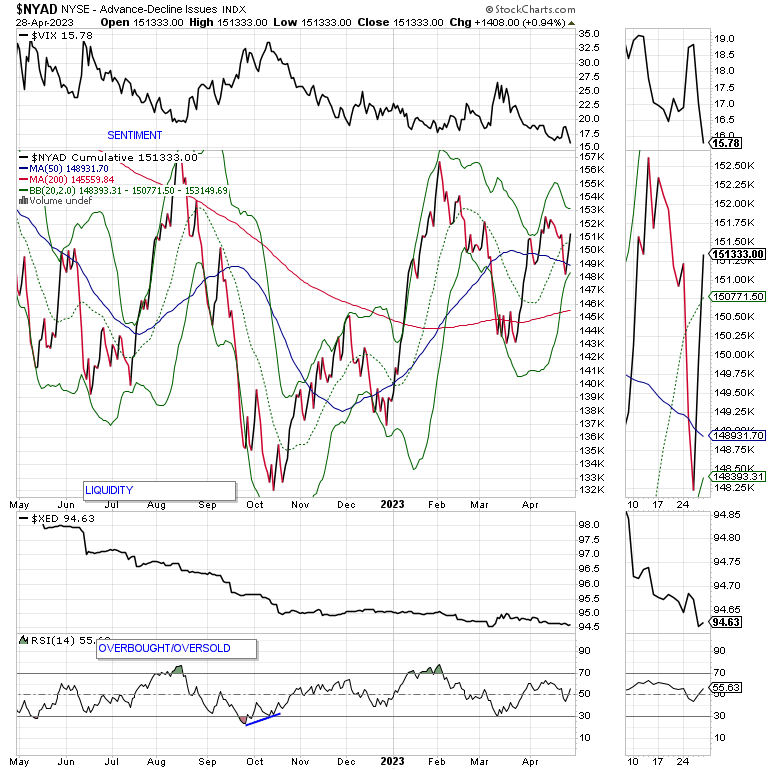
The New York Stock Exchange Advance Decline line (NYAD) once again survived a potential breakdown as it continues to hug its 50-day moving average, while remaining well above its long-term dividing line between bull and bear trends, the 200-day moving average. It would be nice to see breadth improve, but the fact that it has not broken down altogether is very encouraging.
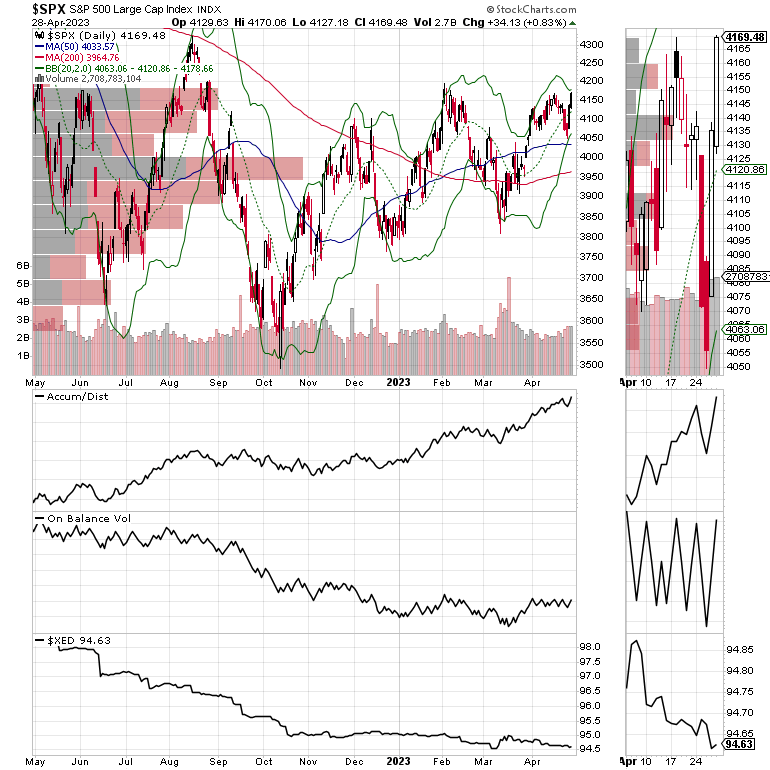
The S&P 500 (SPX) continues to hold between 4100 – 4200, but is getting closer to what could be a major breakout if it can get above the 4200 area. On Balance Volume (OBV) and Accumulation Distribution (ADI) remain very constructive for SPX.
For its part, the Nasdaq 100 Index (NDX) closed above 13,200 on 4/29/23, scoring a nifty breakout with OBV starting to turn up a bit more decisively. If NDX can stay above 13,200, the odds of a significant move higher are well above-average.
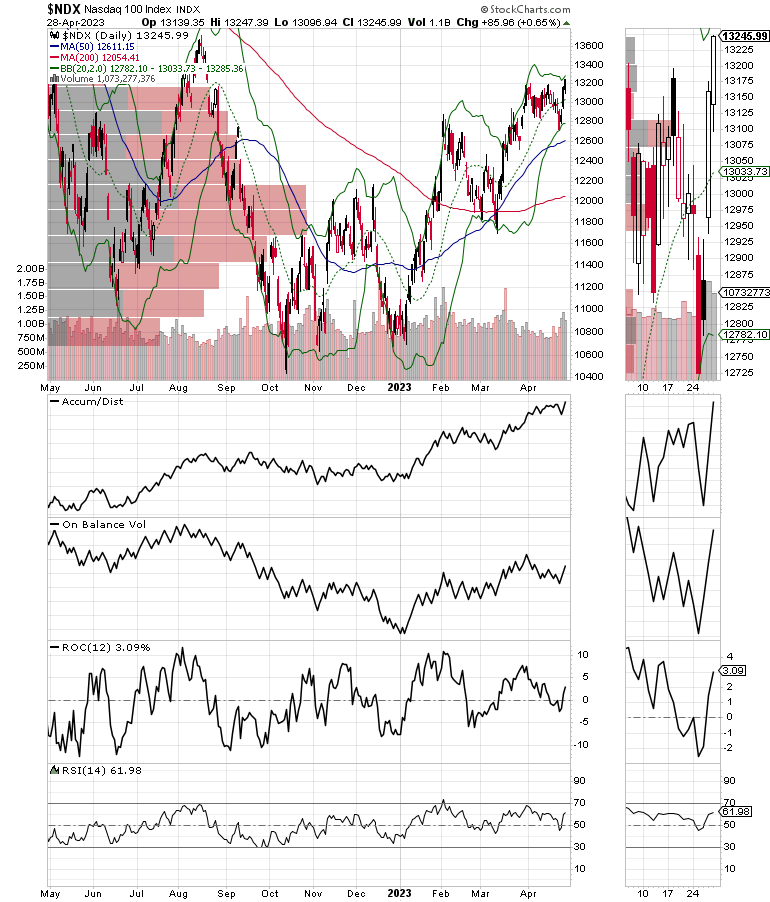
These are bullish developments, which suggests money is moving into technology stocks. When tech stocks rally, they often give the whole market a boost.
VIX Makes New Lows
The CBOE Volatility Index (VIX) again broke to a new low and is now well below 20, a sign that the bears are throwing in the towel. This remains bullish despite the intraday volatility in the options market.
When VIX rises, stocks tend to fall, as rising put volume is a sign that market makers are selling stock index futures in order to hedge their put sales to the public. A fall in VIX is bullish, as it means less put option buying, and it eventually leads to call buying, which causes market makers to hedge by buying stock index futures. This raises the odds of higher stock prices.
Liquidity is Stable. Upcoming Rate Hike Could Crimp.
The market's liquidity retreated as the Eurodollar Index (XED) remains a question mark, even though, for now, it remains stable, yet below 94.75 on Fed hike expectations. A move above 95 will be a bullish development. Usually, a stable or rising XED is very bullish for stocks. On the other hand, in the current environment, it's more of a sign that fear is rising and investors are raising cash.
To get the latest up-to-date information on options trading, check out Options Trading for Dummies, now in its 4th Edition—Get Your Copy Now! Now also available in Audible audiobook format!
 #1 New Release on Options Trading!
Good news! I've made my NYAD-Complexity - Chaos chart (featured on my YD5 videos) and a few other favorites public. You can find them here.
Joe Duarte
In The Money Options
Joe Duarte is a former money manager, an active trader, and a widely recognized independent stock market analyst since 1987. He is author of eight investment books, including the best-selling Trading Options for Dummies, rated a TOP Options Book for 2018 by Benzinga.com and now in its third edition, plus The Everything Investing in Your 20s and 30s Book and six other trading books.
The Everything Investing in Your 20s and 30s Book is available at Amazon and Barnes and Noble. It has also been recommended as a Washington Post Color of Money Book of the Month.
To receive Joe's exclusive stock, option and ETF recommendations, in your mailbox every week visit https://joeduarteinthemoneyoptions.com/secure/order_email.asp.
