There's an old adage of Wall Street, which says: "never short a dull market." And while AI is getting all the press these days, the oil market is about as dull as it gets. This, of course, brings the energy sector to the top of my contrarian alert list.
This is not to say that I'm buying oil-related assets with both hands. It just means that, at this point, it makes more sense to look at energy as a value asset, as it is oversold and ripe for a move up whenever the right set of variables required to deliver such a move line up just right.
In the current world, the variables could line up just right as early as today.
There are No Oil Bulls Left
Nobody loves oil.
The level of bearishness expressed by futures traders is at least equal to where it was during the pandemic, and after the Silicon Valley Bank (SIVB) collapse. The International Energy Agency (IEA), forecasts that, of the expected $2.8 trillion in energy investments for 2023, roughly $1.7 trillion will be allocated to low carbon energy sources, including nuclear, solar, and other potential sources. Only $1.1 trillion will be invested in fossil fuels.
And according to the Financial Times, auctioneers in Texas are trying to unload two brand new fracking rigs, which together cost $70 million, for a starting combined bid of just below $17 million.
Supply is the Primary Influence on Oil Prices
Meanwhile, oil companies are quietly merging with competitors, and exploration outside the United States is continuing aggressively, with new discoveries being frequently announced.
Simultaneously, the U.S. active rig count is slowly falling, led by natural gas. The price of gasoline is steadily rising, as the market begins to price in future supply reductions. Just in my neck of the woods, regular unleaded is up some $0.32 in the last week alone.
That doesn't sound like an industry that's planning on fading away. It sounds like an industry that's hunkering down and waiting for better times and preparing to squeeze supply in order to boost prices.
Charting the Oil Sector
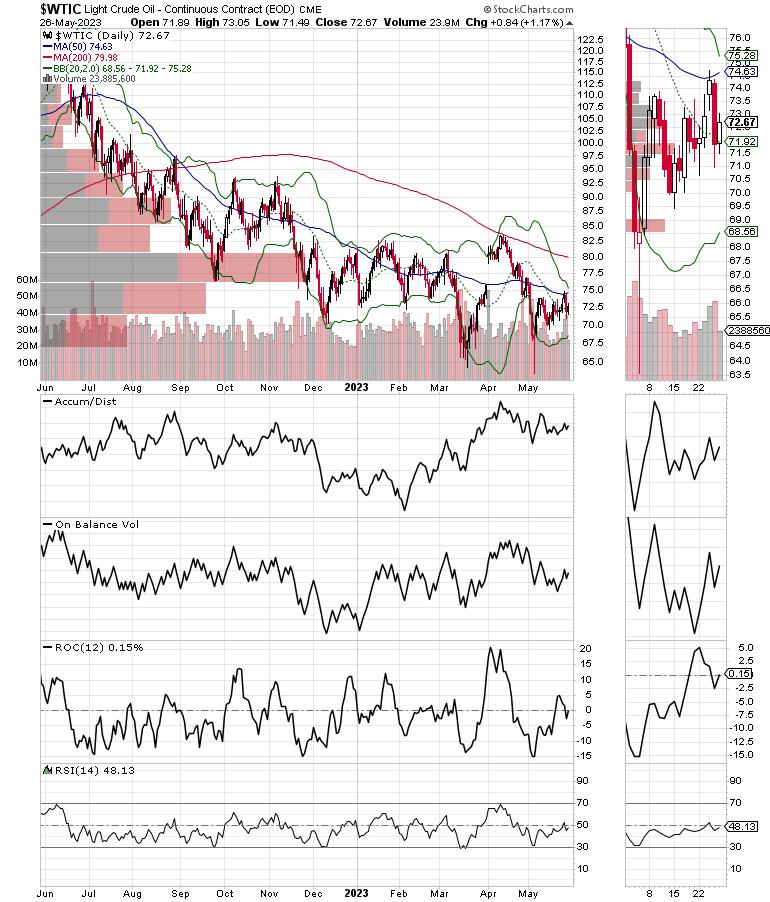
The price chart for West Texas Intermediate Crude, the U.S. benchmark (WTIC), shows the depressed price picture which has led investors to walk away. And, until proven otherwise, there are plenty of sellers at the $75-$80 price area, where a sizeable Volume by Price bar highlights the point of resistance.
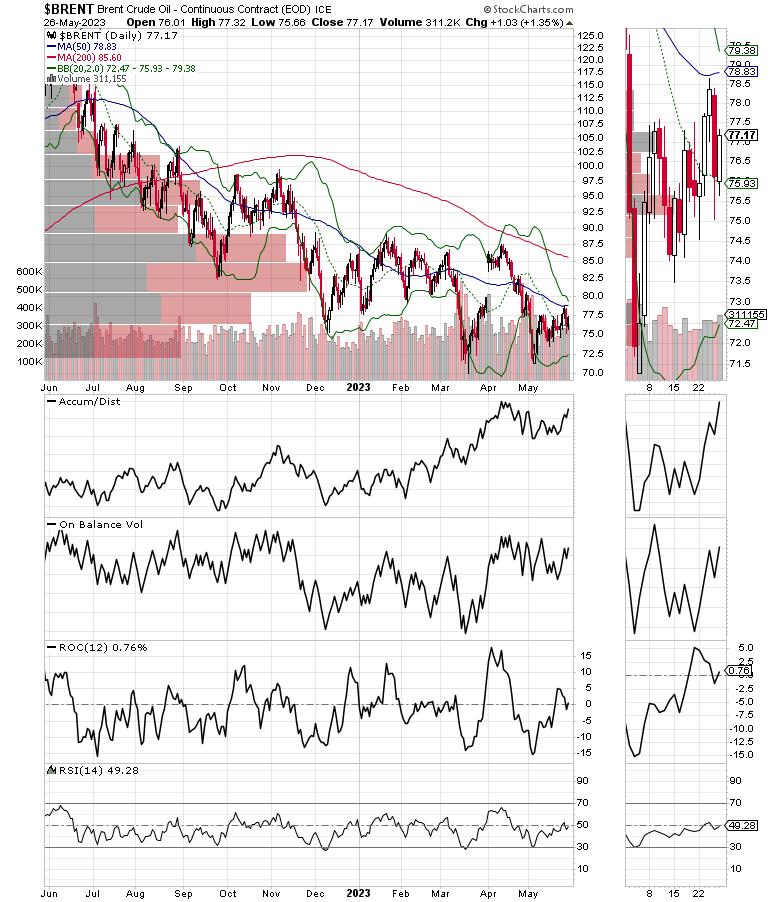
At first glance, there little difference in the general price behavior for Brent Crude, the European benchmark. (BRENT) where there is a resistance band defined by VBP bars between $80 and $90. A closer look reveals an uptick in Accumulation Distribution (ADI) and the semblance of some nibbling in On Balance Volume (OBV). It's subtle, but it's there.
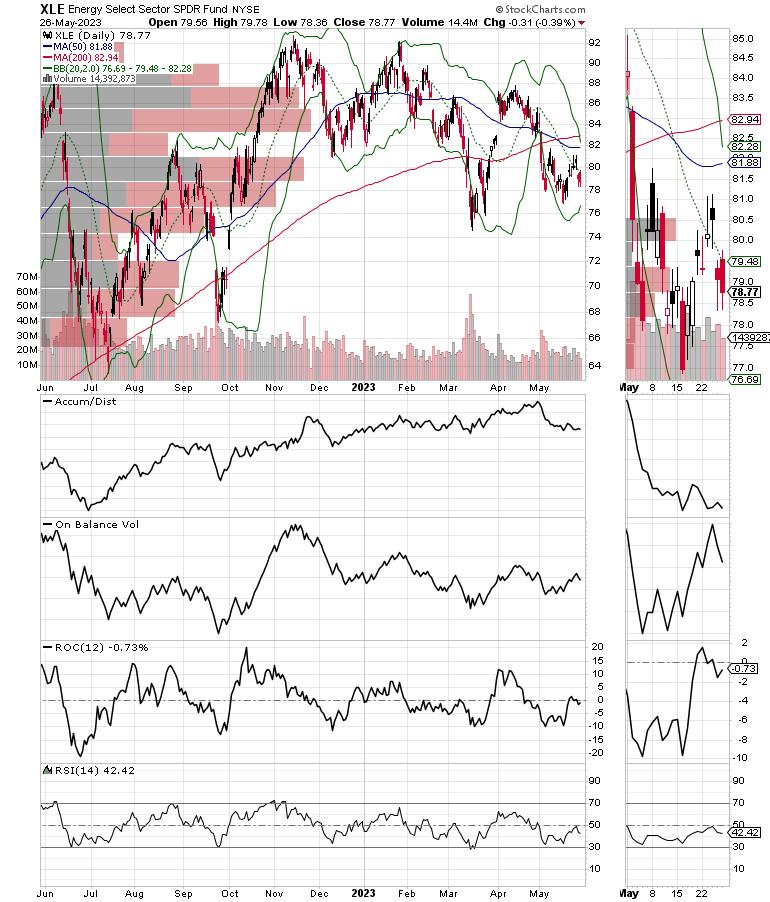
The oil stocks are far from a bull trend. The Energy Select Sector SPDR ETF (XLE) is trading below its 200-day moving average, facing resistance put from $78 to $90 (VBP bars).
So why bother? Simply stated, OPEC has an upcoming meeting on June 3-4. The cartel is not happy about the prices and the way things are evolving. The Saudi oil minister recently warned bearish speculators to "watch out." And my gut is doing flips when I think about oil, as I see gasoline prices creep up when I drive to work.
But mostly, it's because there are no oil bulls left. This is what we saw in the technology sector a few months ago before its current rally. In early 2023, the tech sector was pronounced dead. The stories were all about the technology sector shuddering as the economy slowed. How about this one, from March 2023, which breathlessly announced a 5.2% decrease in semiconductor sales on a month to month basis and an 18.5% year to year drop?
Yet, as validated by the recent AI-fueled rally, the bad news first marked a bottom, while preceding a significant move up in tech shares.
Never short a dull market.
I've recently recommended several energy sector picks. You can have a look at them with a free trial to my service. In addition, I've posted a Special Report on the oil market which you can gain access to here.
Bond and Mortgage Roller Coaster Reverses Course
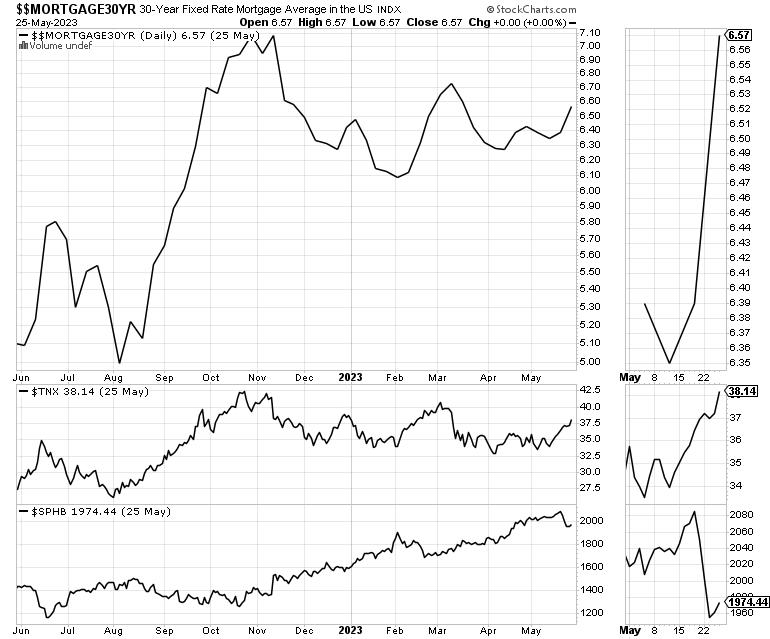
Expect negative news about the effect of rising mortgage rates on the homebuilder industry. That's because, as the chart below illustrates, there is a tight and very close correlation between rising bond yields, mortgage rates, and the homebuilder stocks (SPHB).
Moreover, the rise above 3.75% on the U.S. Ten Year Note yield (TNX) has triggered headlines about mortgage rates climbing above 7%. What the news isn't reporting is that, once bond yields roll over, which they are likely to do at some point in the future when the economy shows more signs of slowing and the Fed finally admits that they must pause, is that mortgage rates will drop and demand for new homes will once again pick up. Thus, we will see the homebuilders pick up where they left off.
As things stood last week, SPHB seems to have made a short term bottom.
For now, expect a continuation of the backing and filling in the homebuilder stocks. But, if I'm right and bond yields reverse course, the homebuilders are likely to rally again.
For an in-depth comprehensive outlook on the homebuilder sector click here.
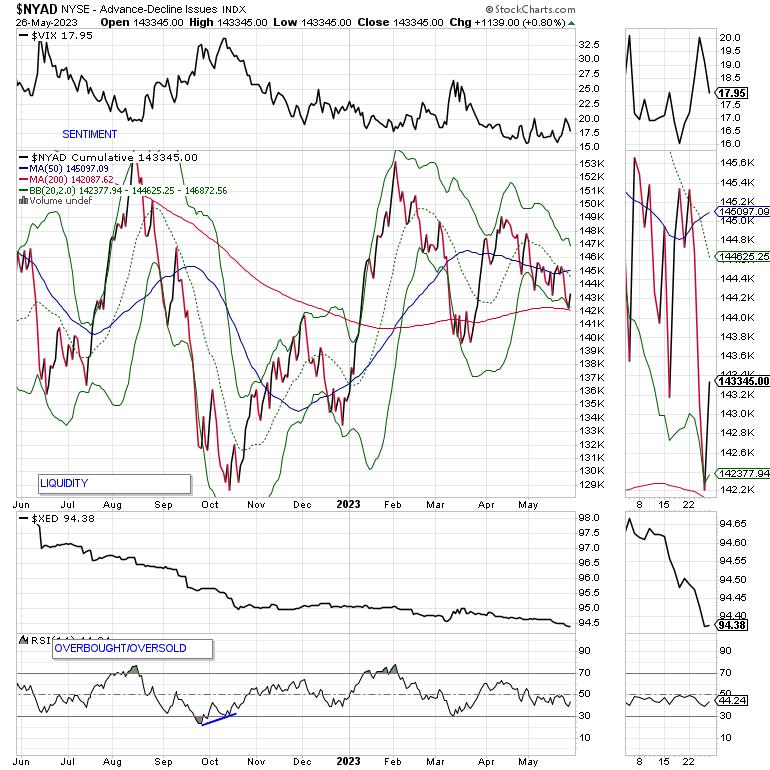
NYAD Holds Above 200-Day Moving Average. SPX Joins NDX in Breaking Out. Liquidity is Shrinking.
The New York Stock Exchange Advance Decline line (NYAD) tested its 200-day moving average on an intra-week basis but did not break below the key technical level. On the other hand, NYAD remained below its 50-day moving average, which is still an intermediate-term negative.
Moreover, with the major indexes (see below) breaking out to new highs, we remain in a technical divergence as the market's breadth is lagging the action in the indexes. This is of some concern, given the fade in the market's liquidity, as I point out below.
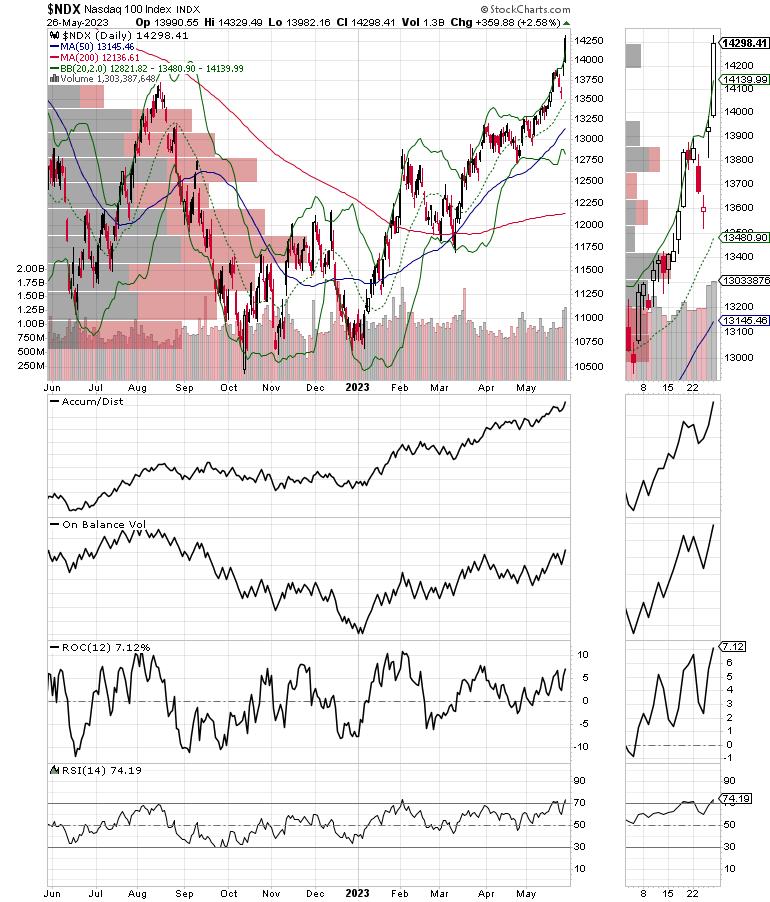
The Nasdaq 100 Index (NDX) extended its recent breakout, closing the week well above 14,200. The current move is unsustainable, so some sort of pullback and consolidation are likely over the next few days to weeks. Both ADI and OBV remain encouraging.
What's more bullish is that the S&P 500 (SPX) finally broke out above the 4100–4200 trading range on 5/24/23. On Balance Volume (OBV) is perking up while the Accumulation Distribution (ADI) indicator is very encouraging.
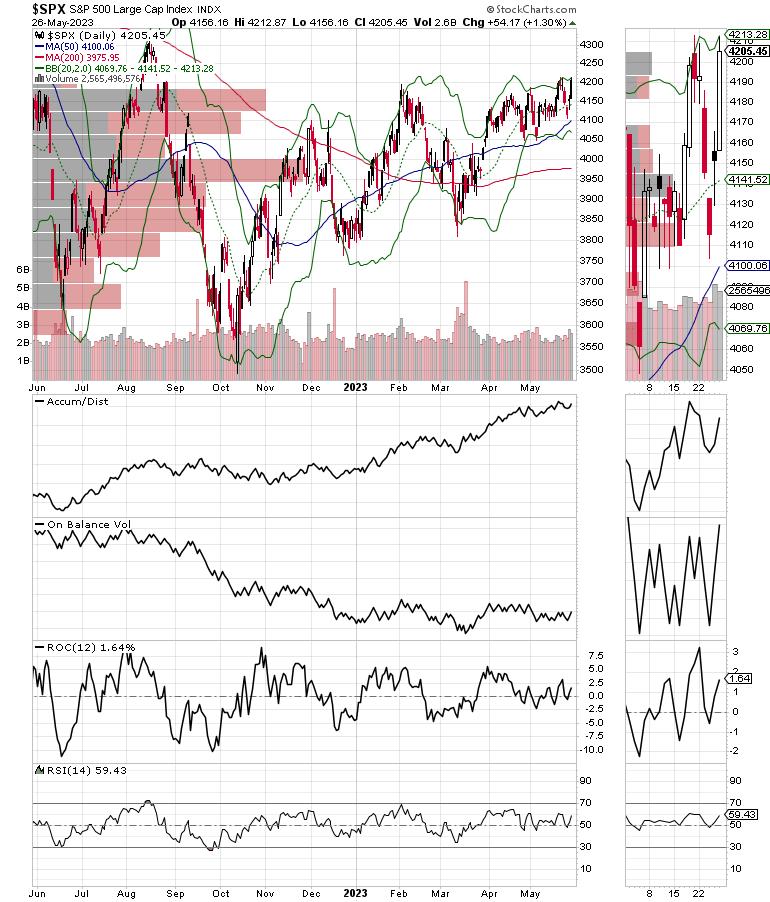
We may be seeing a shift from a short-covering rally to a fear-of-missing-out buyer's rally.
VIX Holds Steady
The CBOE Volatility Index (VIX) remained below 20, as it has since March 2023. This remains a positive for the markets, as it shows short sellers are staying away at the moment.
When the VIX rises, stocks tend to fall, as rising put volume is a sign that market makers are selling stock index futures to hedge their put sales to the public. A fall in VIX is bullish, as it means less put option buying, and it eventually leads to call buying, which causes market makers to hedge by buying stock index futures. This raises the odds of higher stock prices.
Liquidity is Getting Squeezed
The market's liquidity is now in a downtrend. The Eurodollar Index (XED) is now below 94.5, and looks weak. A move above 95 will be a bullish development. Usually, a stable or rising XED is very bullish for stocks.
To get the latest up-to-date information on options trading, check out Options Trading for Dummies, now in its 4th Edition—Get Your Copy Now! Now also available in Audible audiobook format!
 #1 New Release on Options Trading!
Good news! I've made my NYAD-Complexity - Chaos chart (featured on my YD5 videos) and a few other favorites public. You can find them here.
Joe Duarte
In The Money Options
Joe Duarte is a former money manager, an active trader, and a widely recognized independent stock market analyst since 1987. He is author of eight investment books, including the best-selling Trading Options for Dummies, rated a TOP Options Book for 2018 by Benzinga.com and now in its third edition, plus The Everything Investing in Your 20s and 30s Book and six other trading books.
The Everything Investing in Your 20s and 30s Book is available at Amazon and Barnes and Noble. It has also been recommended as a Washington Post Color of Money Book of the Month.
To receive Joe's exclusive stock, option and ETF recommendations, in your mailbox every week visit https://joeduarteinthemoneyoptions.com/secure/order_email.asp.
