
The eurodollar futures contract is now no more, having been replaced by the new SOFR contract (Secured Overnight Financing Rate). For those unfamiliar with the term eurodollar, it is not a reference to the currency markets, but rather it referred to dollar-denominated time deposits in European banks. So you can think of it as LIBOR futures.
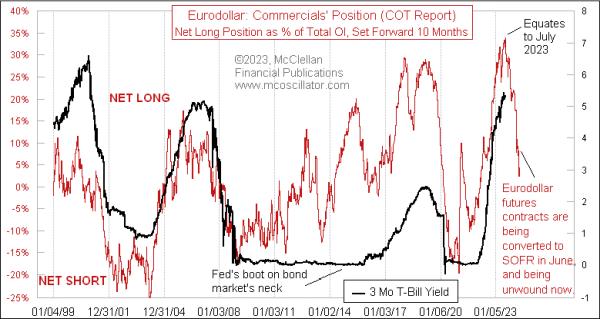
For a variety of reasons that are not important here, the CME decided to get rid of the eurodollar contract, and it spun up the SOFR as its replacement back in 2018. The sad part of this for me is that, for many years, I have gotten great insights from the Commitment of Traders (COT) Report data on eurodollar futures. The chart above shows how it gives about a 10-month leading indication of what short-term interest rates are going to do. 10 months ago, this indicator was peaking, which tells us that a peak for short-term interest rates is due right now, regardless of what Jerome Powell thinks.
The red line in this chart reflects the net position of the "commercial" traders of eurodollar futures as a group, as reported each week in the COT Report. The commercials are the big banks, who used these futures contracts as a way of offsetting their deposit/loan imbalances and interest rate risks. The changes in their net positioning carried a magical message about what future interest rate movements were going to look like.
Or, at least, that was true most of the time. When Ben Bernanke was Fed Chairman, the Fed implemented its "zero interest rate policy," or ZIRP, which held short-term rates down to nothing for several years. That did not match the message of this model, as you can see in the middle of that chart above. But once the Fed relented and allowed interest rates to rise again, the correlation was restored.
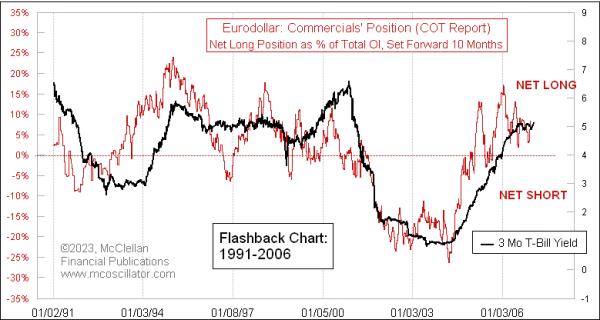
This correlation was working even before the period shown in that chart above. Here is a flashback chart from 1991-2006, showing that the 10-month leading indication relationship was working even back then (although, to my knowledge, no one had discovered it back then until I figured it out years later). Note that the red line with the COT Report data is shifted forward by 10 months in this chart.
For many years before I discovered the 10-month leading indication these data gave for short term rates, I had used the eurodollar COT data as a 1-year leading indication for the stock market. And it worked great. Here is a chart showing that relationship from 1998-2016, with the red plot of the eurodollar COT data shifted forward by 1 year:
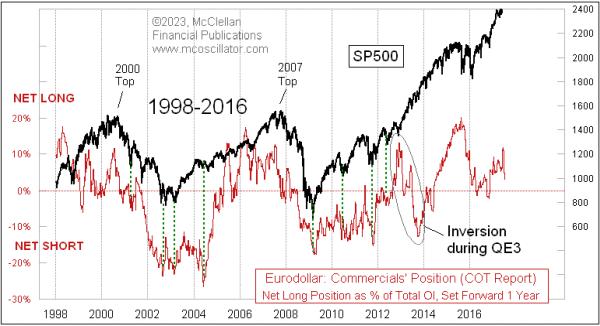
I note in the chart that this relationship did not work for a while in 2013, which was when the Fed started QE3. That was their largest ever effort (before COVID and QE4) to buy up Treasury debt, as well as mortgage-backed securities (MBS) in order to stabilize the banking system and stimulate the economy. QE3 was pretty disruptive, arguably in a good way, or at least in a bullish way. A lot of my other leading indications had also called for a stock market dip in 2013, which did not come about because of that stimulative effect from QE3. By early 2014, however, the relationship was back to working nicely again, foretelling the stock market's movements a year ahead of time.
Curiously, this relationship stopped working in 2018, which was, coincidentally, when the SOFR futures first started trading. I am not sure if that was cause and effect, especially since the SOFR trading volume and open interest were small at first. Whatever the reason, my once-great leading indication stopped working then, which is a great lesson for all of us not to come to count on anything working forever. But the eurodollar COT data did continue working beyond 2018 as a leading indication for short-term interest rates.
So with the eurodollar futures contract now having fully ridden off into the sunset, and its once-amazing COT Report data leading indications going away too, the natural question is whether its replacement, the SOFR contract, and its COT data will perform the same magic tricks. The answer is simultaneously amazing and frustrating.
I have been working with the SOFR COT data since early 2022, seeking that answer. What I have found is that, yes, the SOFR COT data do provide an interesting leading indication for the stock market, and I have shared that with subscribers of our twice monthly McClellan Market Report and our Daily Edition.
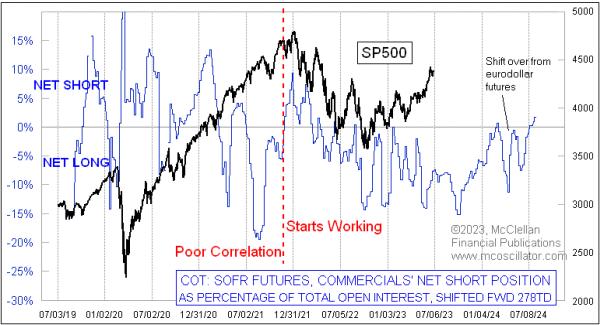
There are two curious points about this relationship. The first is that the lag time which works best is about 13 months, instead of the 12 months that had worked before with the eurodollar COT data. And that lag time is a bit imperfect, with the stock market sometimes running a bit early or late compared to the model, and varying back and forth between early and late, so I'm never sure exactly how to interpret its message.
The second curious point is that the relationship did not work at all during the first 3 years of the SOFR contract's existence. Correlation back then was horrible, but then, starting in late 2021, it seemed to finally click and start working. It may be that the SOFR was so new at first, and not being widely adopted yet, so the message from the big banks about future liquidity flows was just not yet contained in these data early on.
I will be continuing to feature this SOFR COT model in our twice monthly newsletter and Daily Edition, so, if you are interested in seeing how things turn out, and you are not already a subscriber, I hope you will decide to give one or both a try. You can sign up at https://www.mcoscillator.com/market_reports/.