First things first. Last week, the headlines blared the S&P 500 index ($SPX) is in a bull market after a 20% gain from the October 2022 bottom. That's nice, but the real winner has been the Tech sector, as measured by the Nasdaq 100 index ($NDX), up some 38% over the same period.
As the Invesco QQQ Trust ETF (QQQ) shows (see chart below), the rally started in January 2023, as the tech stocks completed a nifty triple bottom.
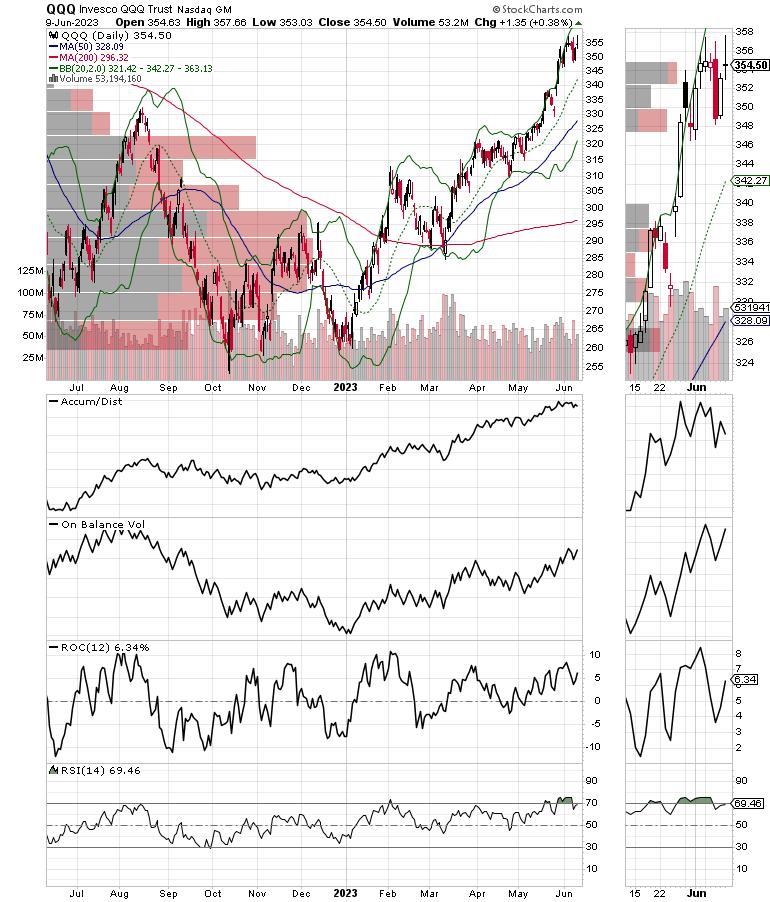
CHART 1: THE TECH RALLY IS IN FULL SWING. The tech rally started in January 2023 after a triple bottom. Chart source: StockCharts.com. For illustrative purposes only.
I pointed out that this likely marked the beginning of a new uptrend in this video on January 27, 2023.
Even more interesting is that the stealth bull market in $NDX, which has now spilled over into $SPX, is six months old and has unfolded even as the Fed has raised interest rates. This suggests that as the Fed's next meeting approaches, this is a great time to take inventory of your portfolio holdings and take some profits, as the AI/Tech fueled rally and the Fed are both due for a pause.
The Fed's Date With Destiny
The Federal Reserve has much to ponder at its June 13–14 meeting. The stock market is booming, while the global economy is showing signs of decelerating rapidly—think China and Europe. The latter has officially slipped into a recession based on recently revised data. In the US, a lot of "soft data" confirms the softening story. As I noted last week:
- The Dallas Fed Survey crashed, falling for the 13th consecutive month; one respondent noted: "There is nothing encouraging on the horizon." Other notable quotes: "orders canceled," "order volume has stalled recently," and "seeing a massive slowdown;"
- The Dallas Fed services survey fell for the 12th straight month. Comments worth noting: "Businesses are preparing for a recession by looking for ways to cut back, which in some ways, works to create a self-fulfilling prophecy;"
- Chicago PMI Collapsed;
- China's manufacturing PMI fell below 50, signaling contraction; and
- US PMI and ISM surveys fell again.
Elsewhere, it seems that OPEC's "hold the line," combined with decreasing oil production in the U.S., are starting to squeeze oil supplies for the summer driving season. Rising gas prices at the pump will likely reduce consumer spending in other areas.
All of this suggests there is a 50-50 case for an official pause announcement from the Fed prior to the next FOMC meeting, unless the May CPI and PPI reports, due out on June 13 and 14 as the Fed meets, throw a wrench into things. And remember, Mr. Powell's press conference will follow.
My guess is we'll get a pause. But don't discount another 25-basis-point rate increase just for "insurance."
OPEC Puts Floor Under Oil Prices for Now
Of late, I've suggested that shorting a dull market is not a good idea, meaning that, given the ultra-bearish sentiment in the oil market, the odds were better than even that a bottom in the price of crude, and likely oil stocks, was likely.
As it happens, after much talk, OPEC+ decided to keep its current production cuts in place (as much as 1.6 million barrels per day) while OPEC kingpin Saudi Arabia promised a "voluntary" one million barrel cut per day.
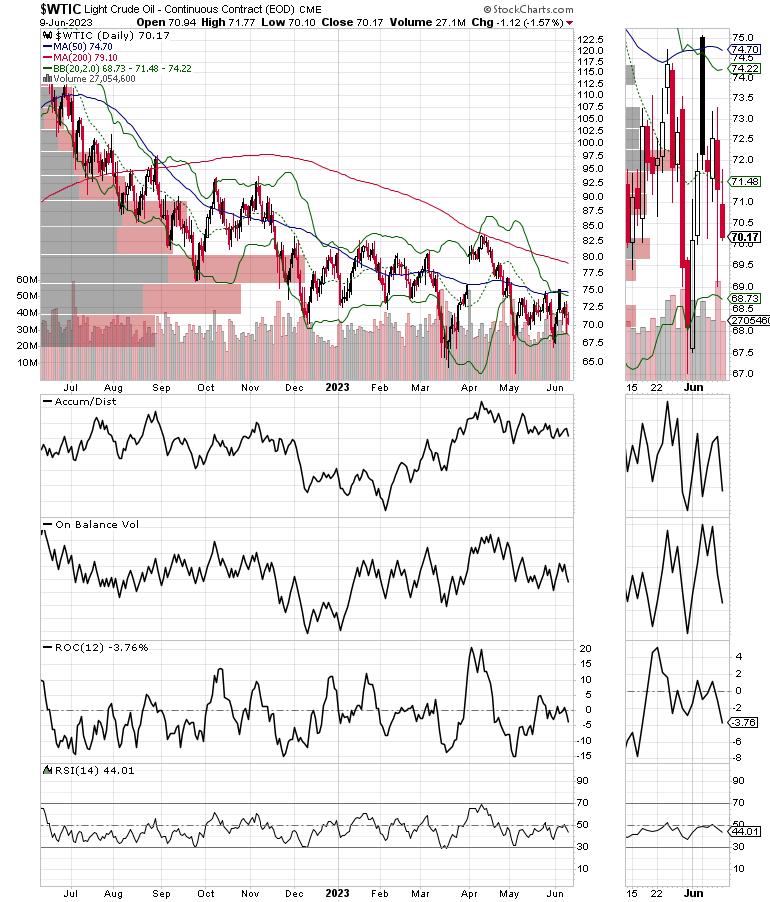
CHART 2: WTIC CRUDE OIL PRICES SLIPPERY. Oil prices continue to slide.
When dealing with OPEC, investors should know that production cuts are just numbers. A lot goes on beneath the surface. So, the key is to adjust expectations based on what OPEC says and watch what they do.
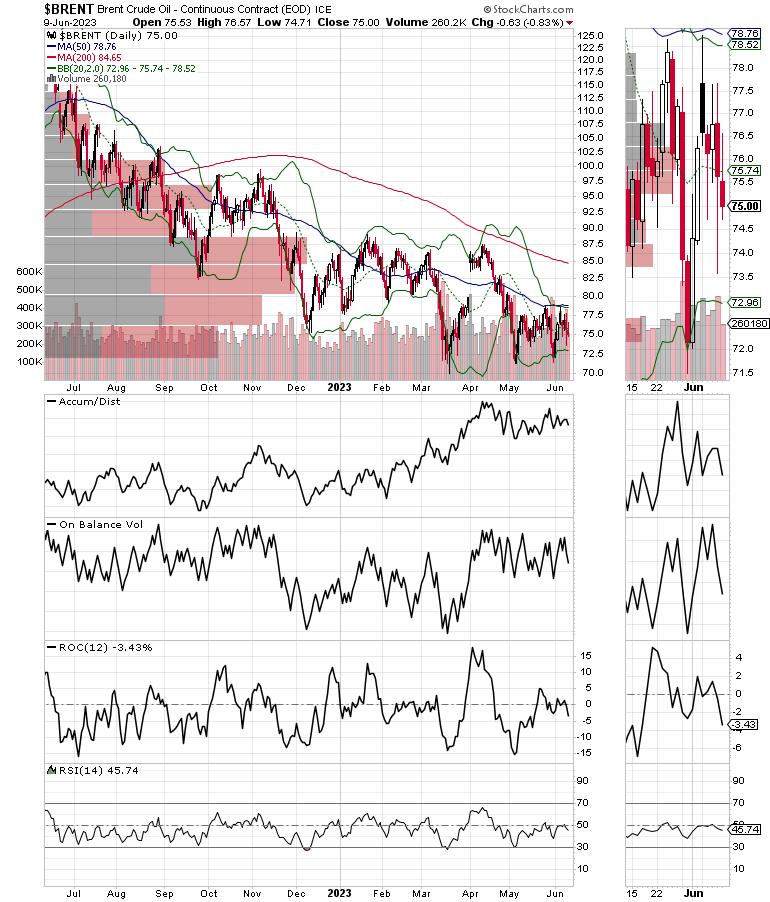
CHART 3: BRENT CRUDE OIL. Nothing surprising here. Brent Crude oil prices also sliding. Chart source: StockCharts.com. For illustrative purposes only.
If OPEC+ is to be believed, then up to 2.6 million barrels of oil per day will be removed from the market by some point in 2023–2024 until proven otherwise.
From a market standpoint, the statement seems to have been good enough to put a bottom in West Texas Intermediate ($WTIC) and Brent Crude ($BRENT) around $70 per barrel.
Moreover, the oil ($XOI) and oil service stocks ($OSX) seem to have put in a bottom, which is bullish since, traditionally, stocks bottom out before the commodity. Already, out in the field, I've noticed gasoline prices firming in my neck of the woods.
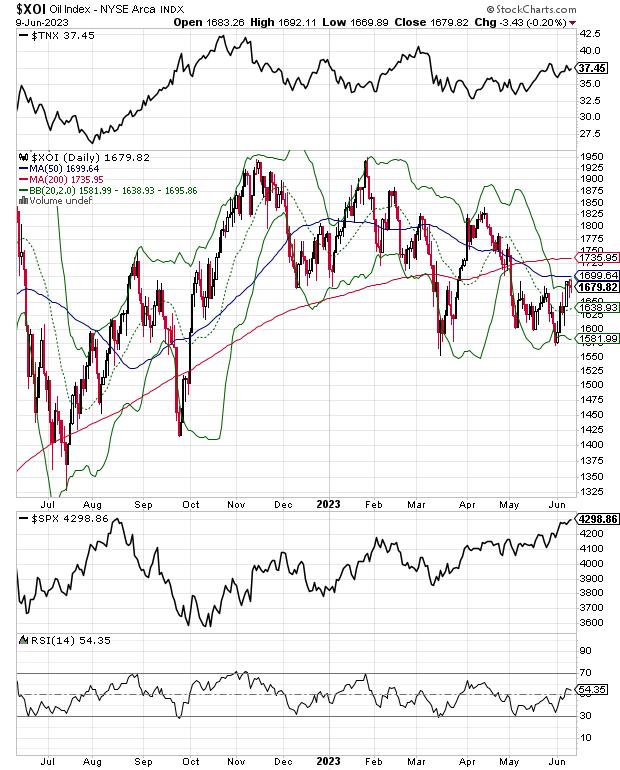
CHART 4: OIL INDEX $XOI ALSO SHOWS A SIMILAR PICTURE. Have oil prices hit a bottom? Chart source: StockCharts.com. For illustrative purposes only.
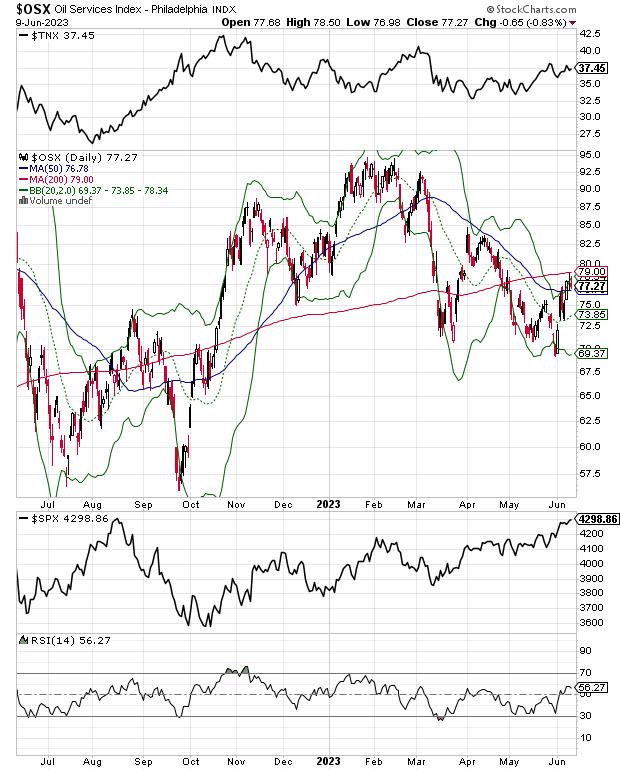
CHART 5: OIL SERVICE STOCKS ALSO LOOK LIKE THEY'VE PUT IN A BOTTOM. Stocks tend to bottom out before the commodity. Does this mean oil stocks will move higher? Chart source: StockCharts.com. For illustrative purposes only.
So, here's a review of what we know as we head into the fullness of driving season:
- OPEC+ is promising to cut production;
- The U.S active rig count is falling, which means the shale belt is following suit;
- Oil and gasoline prices seem to be firming.
It all adds up to one thing: oil prices seem to have bottomed until proven otherwise.
I've recently recommended several energy sector picks. You can look at them with a free trial of my service. In addition, I've posted a Special Report on the oil market, which you can gain access to here.
Bond Yields Remain Below Important Yield Level
The bond market is reaching a decision point as it sorts out the state of the economy and inflation. An important data point under consideration is the steadily rising jobless claims numbers released on June 9, 2023. Jobless claims have been quietly edging higher over the last few weeks as employers reduce new hiring, suggesting a continuation of the economy's slowing.
As a result, the relationship between bond yields, mortgage rates, and homebuilder stocks remains operational. Note the reversal in mortgage rates in the 30-Year Fixed Rate Mortgage Average ($$MORTGAGE). This led to a rally in the homebuilders index ($SPHB).
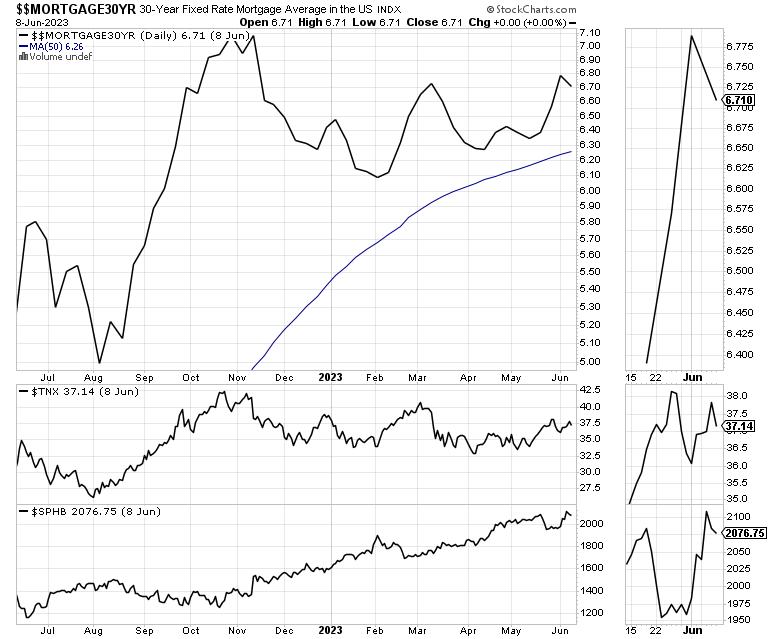
CHART 6: MORTGAGE RATES TURNING LOWER.
The crucial yield point on the 10-Year US Treasury Yield Index ($TNX) is 3.85%. If yields remain below this level, the odds favor a continuation of the steady performance of the homebuilder sector.
I have recently written an extensive report on the outlook for the homebuilder sector, accessible on my Buy Me A Coffee page. To review it, click here.
NYAD Remains Above Support. SPX and NDX Look to Consolidate
As I noted above, the week's headline was that the S&P 500 (SPX) rose over 20% since its October 2022 market bottom. This puts us in a bull market, by definition. I am fine with the concept except that I think the market will consolidate in the short term, which is not a bad thing.
The New York Stock Exchange Advance Decline line ($NYAD) remained above its 50-day moving average, signaling stocks are back in an uptrend.
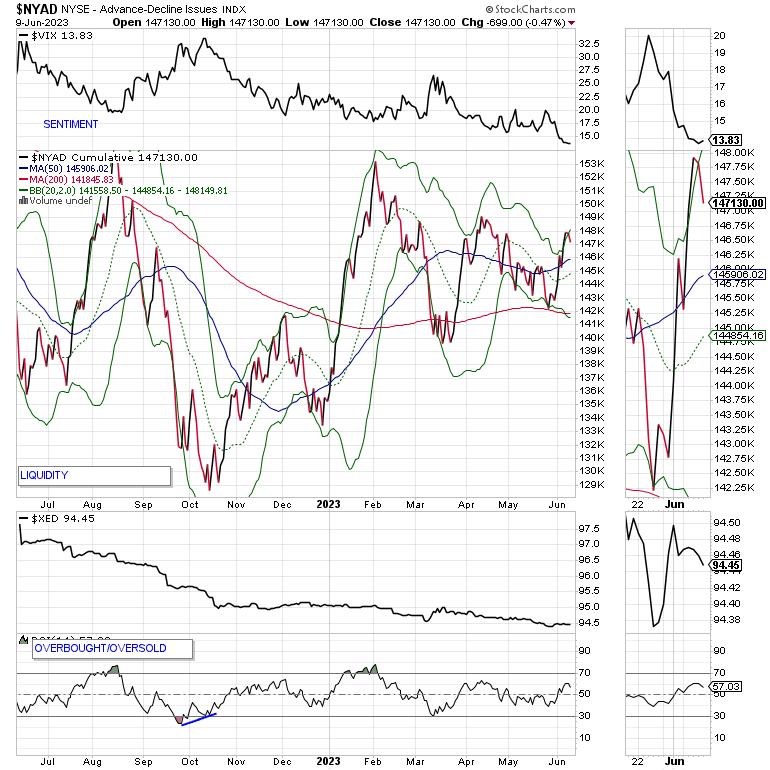
CHART 7: IMPROVING MARKET BREADTH. This supports the upward move in equities. Chart source: StockCharts.com. For illustrative purposes only.
The Nasdaq 100 Index ($NDX) remained above 14,500 and is starting to move sideways as it consolidates its AI-related gains. The Accumulation Distribution Line and On Balance Volume (OBV) remain in bullish postures.
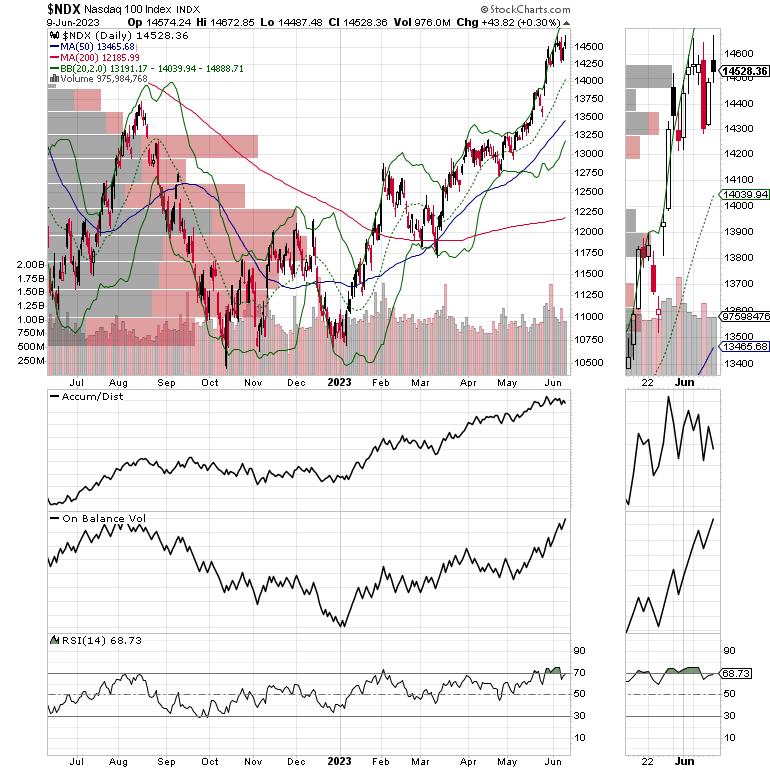
CHART 8: IS THE NASDAQ 100 SHOWING SIGNS OF CONSOLIDATION? Keep an eye on Accumulation Distribution and On Balance Volume for clues of consolidation. Chart source: StockCharts.com. For illustrative purposes only.
The S&P 500 moved above 4300 and looks set to take a breather. Accumulation Distribution Line and OBV look to be in good shape.
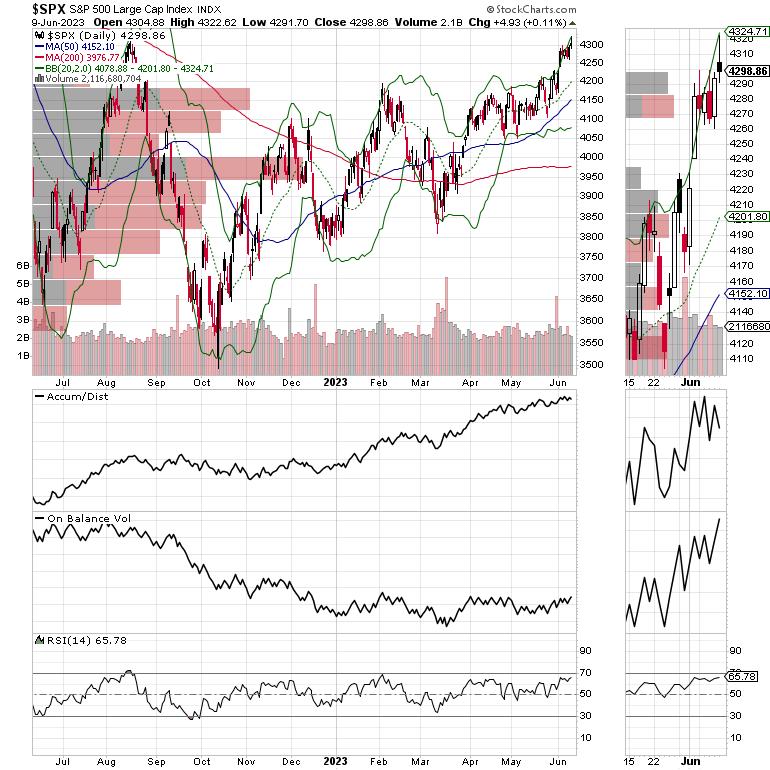
CHART 9: IS THE S&P 500 IN A BULL MARKET? The index broke above 4300 and may take a breather before the Fed meeting. Chart source: StockCharts.com. For illustrative purposes only.
VIX Looks Set to Bottom Out in the Short Term
The Cboe Volatility Index ($VIX) fell to a new low last week as call option buyers overwhelmed the market. This is probably too much bullishness all at once, so I expect a bit of a bounce in VIX, which will likely lead to some backing and filling in the market.
When the VIX rises, stocks tend to fall, as rising put volume is a sign that market makers are selling stock index futures to hedge their put sales to the public. A fall in VIX is bullish, as it means less put option buying, and it eventually leads to call buying, which causes market makers to hedge by buying stock index futures. This raises the odds of higher stock prices.
Liquidity Still Limited but Stable
The market's liquidity may have bottomed out, but it's not bullish or bearish. However, if it stays in the current posture, it will pose little danger. With the Eurodollar Index ($XED), a move below 94 would be very bearish, while a move above 95 would be a bullish development. Usually, a stable or rising XED is very bullish for stocks.
To get the latest information on options trading, check out Options Trading for Dummies, now in its 4th Edition—Get Your Copy Now! Now also available in Audible audiobook format!
 #1 New Release on Options Trading!
Good news! I've made my NYAD-Complexity - Chaos chart (featured on my YD5 videos) and a few other favorites public. You can find them here.
Joe Duarte
In The Money Options
Joe Duarte is a former money manager, an active trader, and a widely recognized independent stock market analyst since 1987. He is author of eight investment books, including the best-selling Trading Options for Dummies, rated a TOP Options Book for 2018 by Benzinga.com and now in its third edition, plus The Everything Investing in Your 20s and 30s Book and six other trading books.
The Everything Investing in Your 20s and 30s Book is available at Amazon and Barnes and Noble. It has also been recommended as a Washington Post Color of Money Book of the Month.
To receive Joe's exclusive stock, option and ETF recommendations, in your mailbox every week visit https://joeduarteinthemoneyoptions.com/secure/order_email.asp.
