TAKEAWAYS
- The rise in Treasury yields led to a rise in mortgage rates, which resulted in a selloff in homebuilder stocks
- If Apple's stock rises above its 50-day moving average the stock could be a potential buy
- The rise in crude oil prices can help oil refiners with some stocks breaking above key resistance levels
In uncertain times, selective investors will outperform the indexes. We're entering a market where external events and seasonal forces combine to increase uncertainty.
Of course, much of the market's insecurity can be placed at the Fed's feet, considering the events that will take place on September 19 and 20 at the next FOMC meeting. Before the meeting, we will get the opportunity to respond to data points that presumably will affect the Fed's decision.
Still, geopolitical events often extend into the corporate realm—Apple (AAPL) and the oil market.
From a trading standpoint, it's best to focus on each stock in portfolios separately while monitoring the effect of the market's action on its price action, especially in areas where supply constraints and stable to rising demand favor producers.
Supply and Demand Ties Bonds, Mortgage Rates, and Homebuilders
The big fear in bond land is that the Federal Reserve will continue to raise interest rates. The problem is that this fear changes with any news development. So if a number, say CPI, comes out as bullish, we see a drop in yields. On the other hand, if the PPI, usually received on the next day, is seen as bearish, yields climb—often to a greater degree than the drop the day before, when the news was "bullish."
The result is bond yield volatility, which leads to bond trader indecision and then bleeds into stocks.
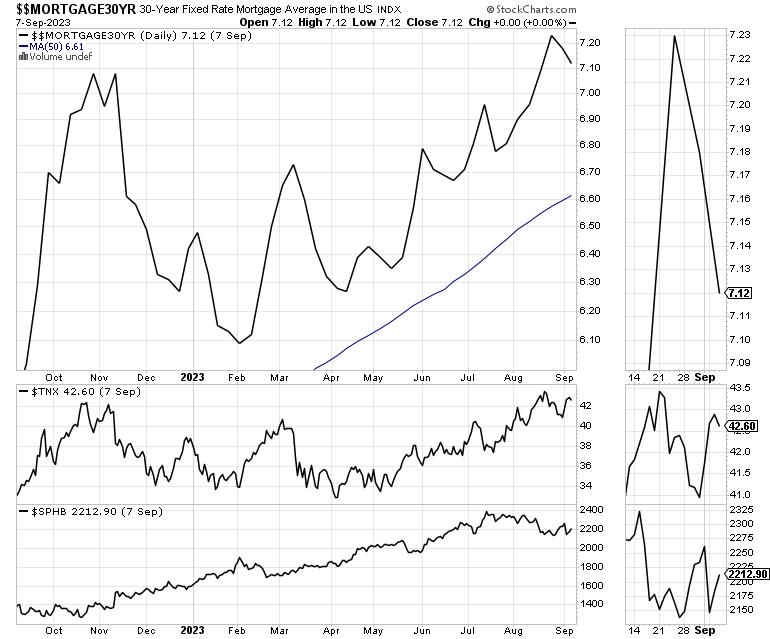
Nowhere is this relationship clearer than in the composite price chart, which relates the 10-Year U.S. Treasury Yield Index ($TNX) to the 30-year mortgage rate ($$Mortgage30yr) and the S&P Homebuilders Sector Index ($SPHB).
The recent rise in $TNX led to a rise in mortgage rates, which led to the selling in homebuilder stocks. On the other hand, as we've recently seen, even a short-term pullback in $TNX has a beneficial effect on mortgages, which then translates into better performance for homebuilders.
The reason for this nearly instantaneous response between these three metrics is quite simple: tight home supplies favor homebuilders. Thus, any improvement in bond yields works through the system rapidly, and the market expects a burst in home buyers.
Stay smart on real estate and housing here.
China's Apple Move Sparks Tech Contagion. Buy the Apple Dip?
The news that China is restricting the use of iPhones by its government workers hit Apple's (AAPL) shares hard last week and spread throughout the technology sector. Technology stocks were already wobbly after news that China's Huawei developed a new-generation phone based on a chip that the market had considered to be beyond China's technological reach due to US sanctions on technology-sharing with Beijing.
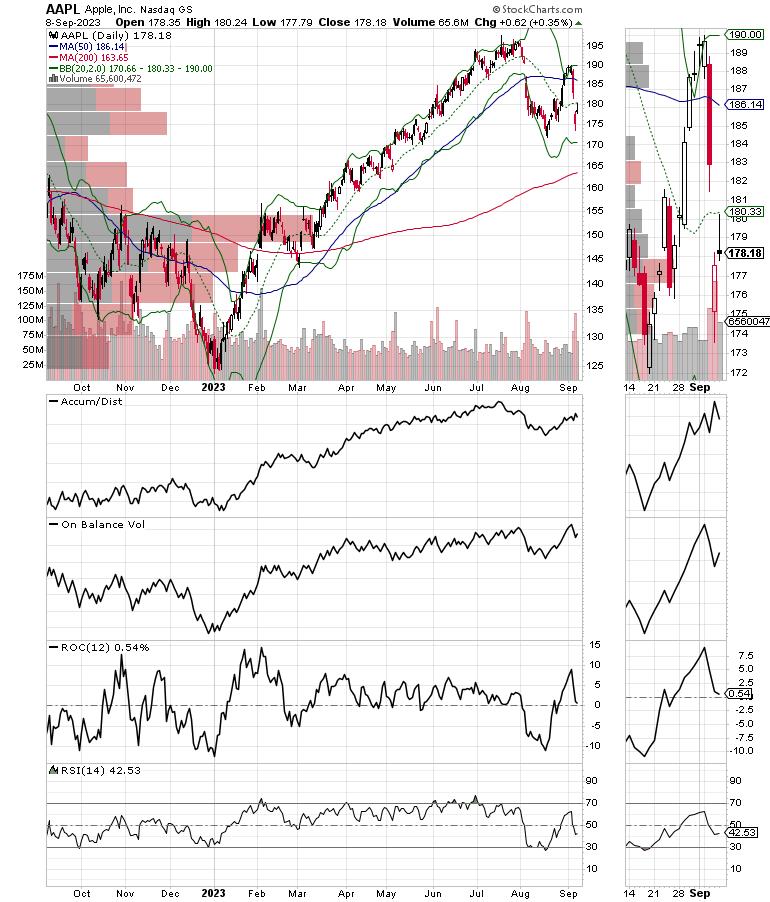
The selling in Apple may be justified, given the potential for the company to lose a significant portion of its business due to the ban. But details are sketchy, and the stock fell but didn't break long-term support.
Apple was already in a bit of a funk due to the general status of the tech market and, as I described above, fears that the Federal Reserve would raise interest rates again, further eroding consumer confidence. Given Apple's global reach and its ability to manage through tough times, it's more likely that the Fed is a more prescient issue than China's ban on iPhones.
So, is Apple a buy at these levels? Much depends on what happens in the next few days to weeks. If support holds and the stock can form a credible base, it may be worth considering once it rises above its 50-day moving average. On the other hand, there isn't a lot of credible support until the $155–$160 area, so the intermediate term may be rocky for the stock.
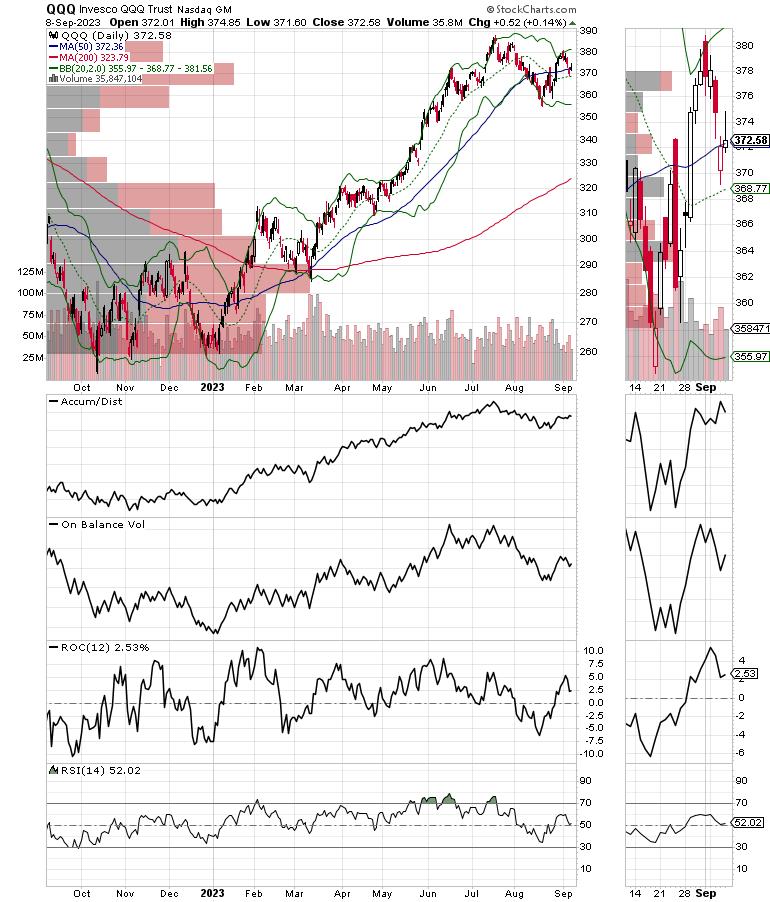
The selling in Apple spilled into the Technology sector. As usual, the Invesco QQQ Trust (QQQ) is a handy tool for monitoring tech stocks. And last week was no exception, as QQQ tumbled below its 50-day moving average. If there is a silver lining, it's that it held above $370 and the important support level provided by the tree bar Volume-by-Price (VBP) cluster on the left of the chart. If QQQ breaks below that cluster, it would signal that the sellers are winning the battle and that a move to the 200-day moving average will likely materialize.
I have an expanded review of what's happening with AAPL, MSFT, NVDA, and TSLA here.
Oil Heats Up Some More as Wind Craters
Another sector where supply favors producers is crude oil ($WTIC), which continues to attract money while the wind power stocks are in freefall. Regular readers should not be surprised about the goings-on in the oil market, given my "Never Short a Dull Market" article in May, which predicted the current scenario as global oil supplies tighten.
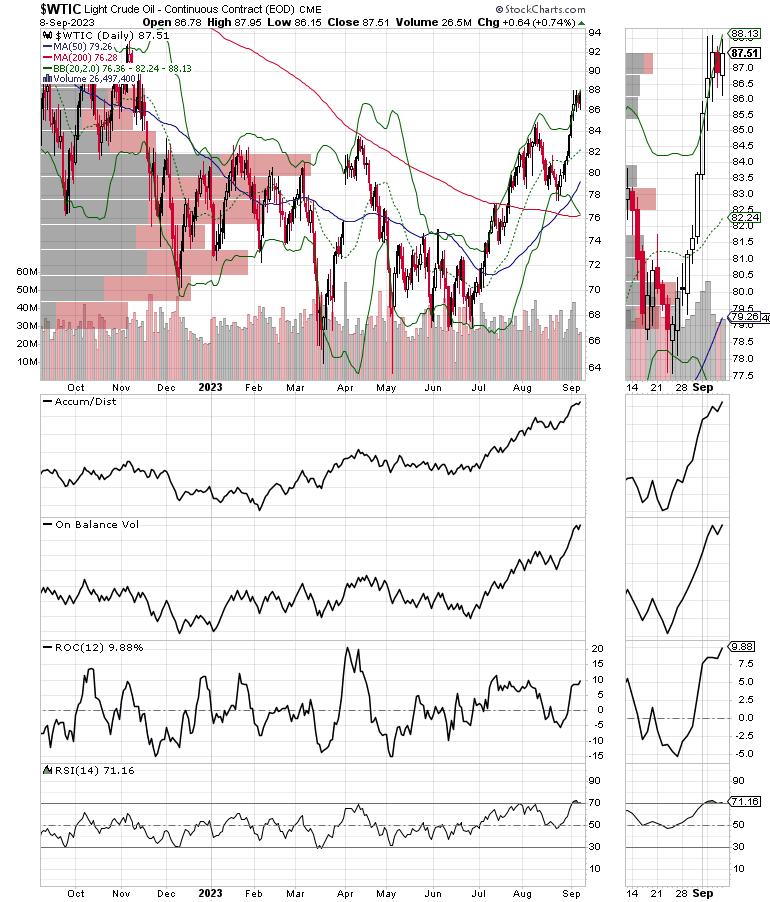
Once again, this week's US EIA data confirmed the supply squeeze as oil supplies were drawn down by another six million barrels. The four-week total is now somewhere near a 40 million barrel deficit. As a result, $WTIC moved higher and now faces a test at the $90 level.
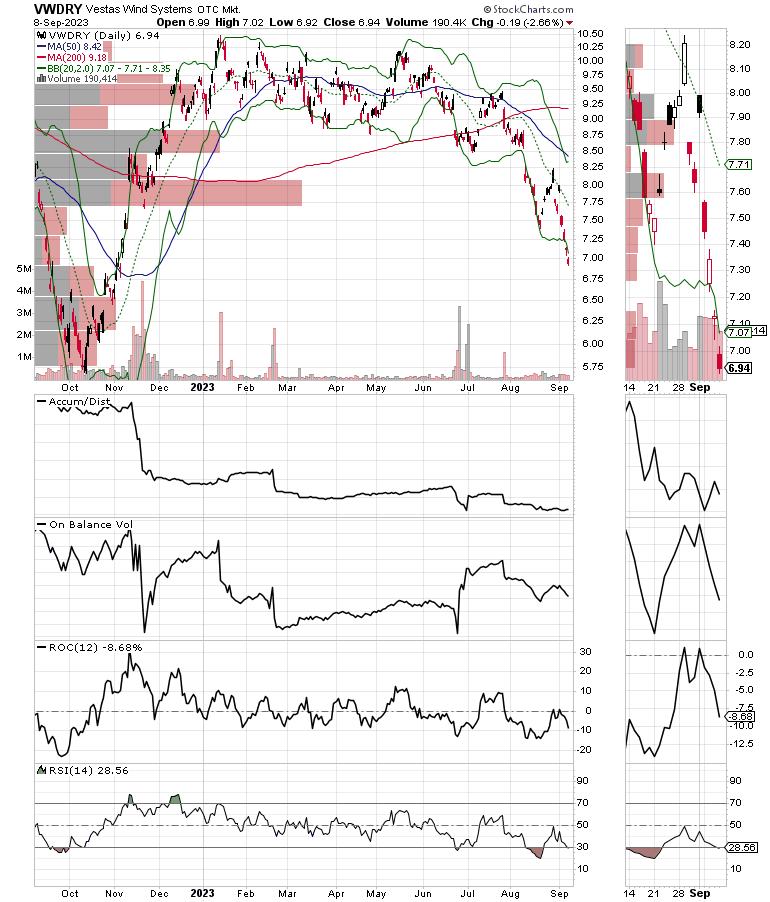
The bullish action in oil is being aided by the collapse of the wind energy sector, where costs are skyrocketing, and companies are stopping work on key projects unless governments increase subsidies.
The stock of sector bellwether Vestas Wind Systems (VWDRY) paints a woeful picture as key price support levels continue to give way to selling pressure. Moreover, the decline is occurring amidst an almost complete lack of short sellers (ADI is flattening) while On Balance Volume (OBV) is rolling over as hopeful dip buyers are heading for the exits.
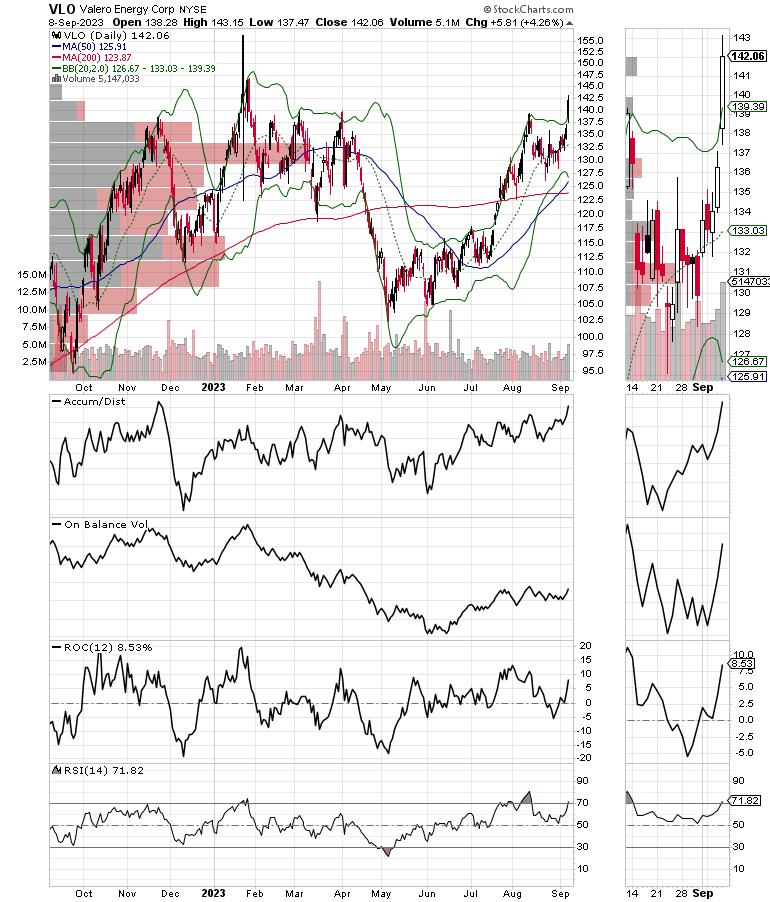
The latest group of stocks to break out in the oil sector is the refiners. Sector bellwether Valero Energy (VLO) just moved above a key resistance level as money is starting to flow in (rising OBV) while short sellers scamper (rising Accumulation Distribution Line).
Things are happening fast. Oil, tech, housing, and bonds are all making their move. What's your plan of action in this market? Join the smart money at JoeDuarteintheMoneyOptions.com. You can look at my latest recommendations FREE with a two-week trial subscription.
You can also review the supply-demand balance in the oil market and what the future may hold here. And if you're a Tesla fan, I'm reviewing some interesting developments in the stock, which you can review Free of charge here.
Breadth Recovery Stalls Again
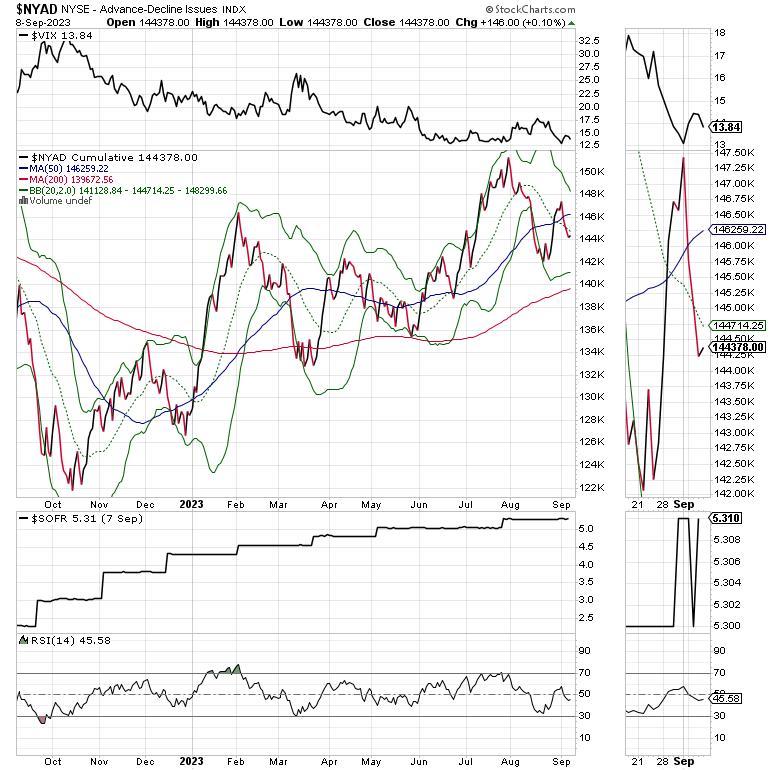
The NYSE Advance Decline line ($NYAD) is increasingly volatile. Two weeks ago, it was moving higher, but most recently, it showed signs of weakness. All of which is making trading difficult while creating uncertainty and adding to the overall volatility of the market.
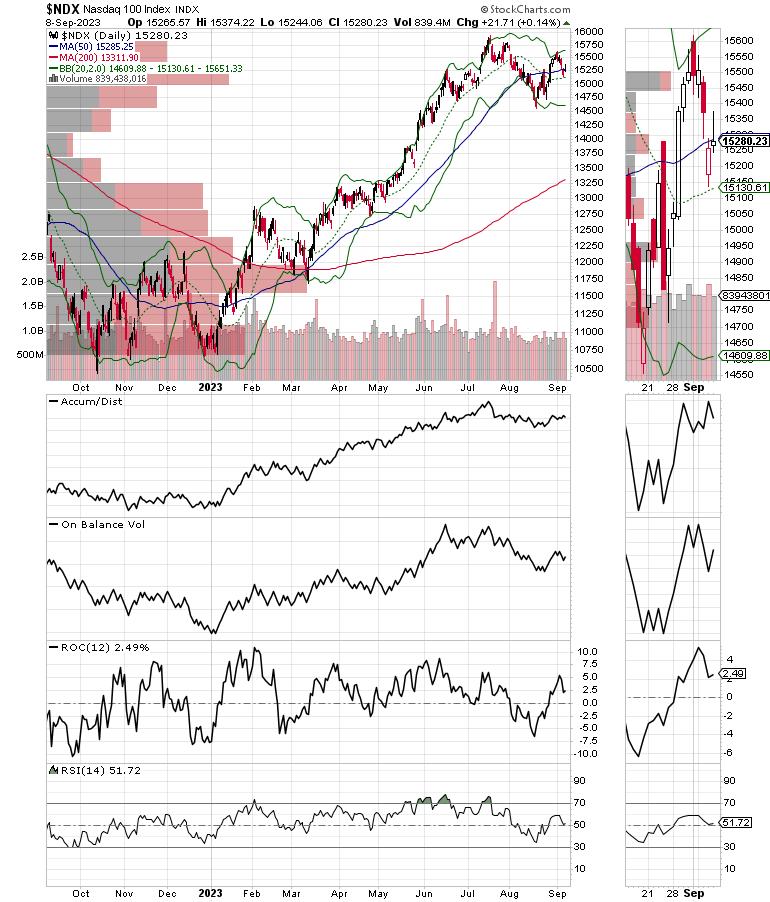
The Nasdaq 100 Index ($NDX) is still deciding what to do. So far, it's holding up above 15000, where there is a cluster of Volume-by-Price bars (VBP). The Accumulation Distribution Line and OBV are trying to stabilize.
The S&P 500 ($SPX) is struggling between 4350 and 4600. There is a cluster of VBP bars, plus 20- and 50-day moving averages in the area, which means this will be an active trading range.
VIX Remains Below 20
The Cboe Volatility Index ($VIX) remains subdued below the 20 level. This is still good news, but it hasn't had much of an effect on the market. A move above 20 would be very negative.
When the VIX rises, stocks tend to fall, as rising put volume is a sign that market makers are selling stock index futures to hedge their put sales to the public. A fall in VIX is bullish, as it means less put option buying, and it eventually leads to call buying, which causes market makers to hedge by buying stock index futures. This raises the odds of higher stock prices.
Liquidity Remains Stable
Liquidity is stable. The Secured Overnight Financing Rate (SOFR), which recently replaced the Eurodollar Index and is an approximate sign of the market's liquidity, just broke to a new high in response to the Fed's move. A move below 5.0 would be more bullish. A move above 5.5% would signal that monetary conditions are tightening beyond the Fed's intentions. That would be very bearish.
To get the latest information on options trading, check out Options Trading for Dummies, now in its 4th Edition—Get Your Copy Now! Now also available in Audible audiobook format!
 #1 New Release on Options Trading!
Good news! I've made my NYAD-Complexity - Chaos chart (featured on my YD5 videos) and a few other favorites public. You can find them here.
Joe Duarte
In The Money Options
Joe Duarte is a former money manager, an active trader, and a widely recognized independent stock market analyst since 1987. He is author of eight investment books, including the best-selling Trading Options for Dummies, rated a TOP Options Book for 2018 by Benzinga.com and now in its third edition, plus The Everything Investing in Your 20s and 30s Book and six other trading books.
The Everything Investing in Your 20s and 30s Book is available at Amazon and Barnes and Noble. It has also been recommended as a Washington Post Color of Money Book of the Month.
To receive Joe's exclusive stock, option and ETF recommendations, in your mailbox every week visit https://joeduarteinthemoneyoptions.com/secure/order_email.asp.
