Stock traders seem stunned by the recent fall in bond yields and the concurrent rally in stocks. As a result, short sellers have scrambled to reverse their bearish positions, which led to a gigantic short squeeze. But as short-selling upward pressure recedes, buyers must step up to keep the rally going.
Regular readers of this column were not surprised by the rally, given the multiple alerts I posted noting the likelihood of a meaningful market bottom emerging, due to the extraordinary technical picture which had developed in the bond market and the ensuing gloom and doom in stocks as early as September 2023. And although there are no guarantees, the ongoing rally in both stocks and bonds has a great chance of continuing, due to the bullish seasonality which kicks into high gear with the traditional Thanksgiving rally.
So, how reliable is the Thanksgiving period as a launching pad? According to data compiled by Benzinga.com, Thanksgiving week delivers higher stock prices 68% of the time, with an average gain in the S&P 500 of 0.64% compared to an average gain of only 0.16% for all the other weeks of the year. Therefore it pays to be prepared.
Bond Yields
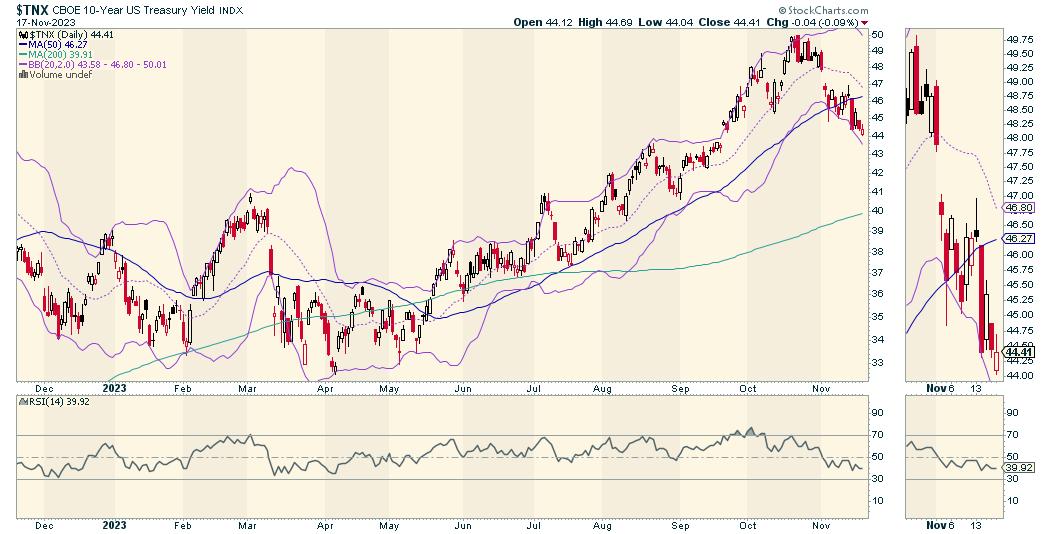
So far so good with the reversal in the bond market. The U.S. Ten-Year Note yield (TNX) is below 4.5% and its 50-day moving average. This is bullish for both stocks and bonds. A more important yield range is 4.3%-4.4%. A sustained break below this key yield band could take yields back to 4%.
Of course, amongst the major beneficiaries of the lower interest rates have been the homebuilders, as reflected in the recent price action for the SPDR S&P Homebuilders ETF (XHB), which is now trading above the $80 area and is due for a consolidation.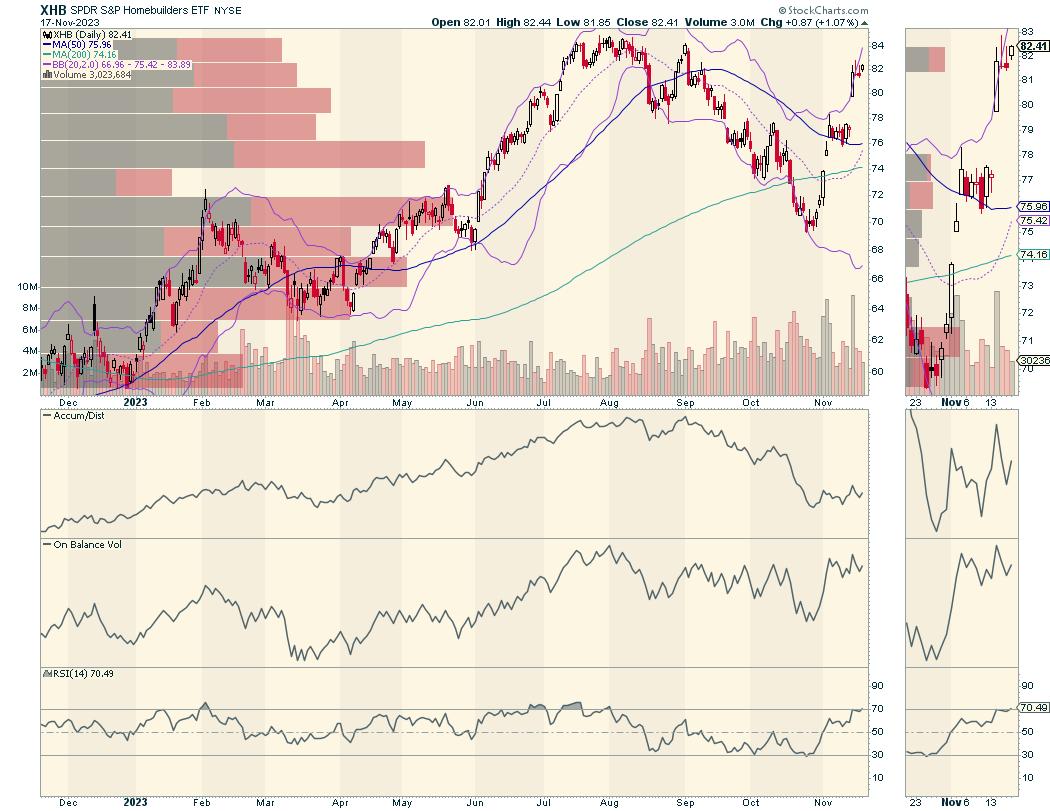
Certainly, the long-term fundamentals of supply and demand in the housing market remain in favor of the homebuilders and related sectors. These include real estate investment trusts (REITs) which specialize in home rentals and related businesses.
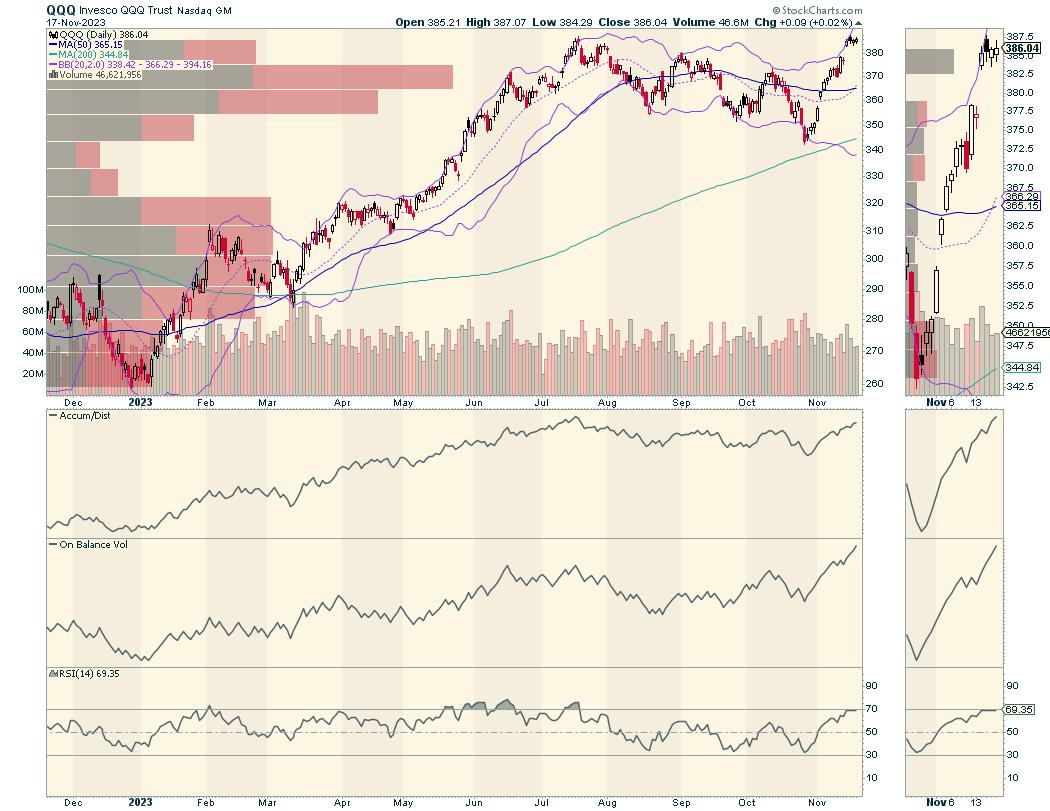
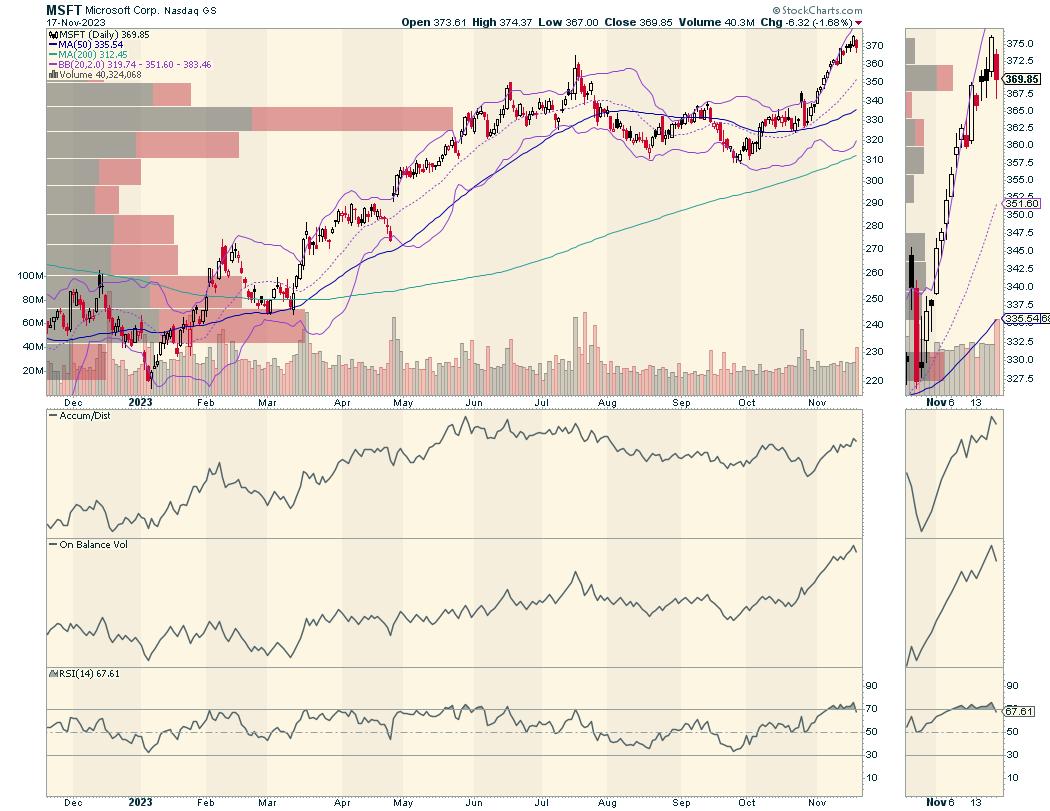
Another huge winner resulting from the drop in TNX has been the large-cap technology sector. This is clear in the price chart for the Invesco QQQ Trust ETF (QQQ), which is near its recent highs. QQQ has been powered higher by large-cap technology stocks, especially the wild ride in Microsoft (MSFT).
And while both homebuilders and technology stocks have already realized big gains and are due for a consolidation, there are new sectors where investors may find value in this market, as I describe directly below.
For more on homebuilder stocks, click here. For the perfect price chart set up, check out my latest Your Daily Five video here.
Emerging Value in Unexpected Areas
The stock rally in the first half of 2023 was powered by the artificial intelligence (AI) sector. Indeed, for a while AI dominated money flows, until reality set in and rally fizzled. Interestingly, AI may be staging a quiet comeback, as money is once again trickling into the sector.
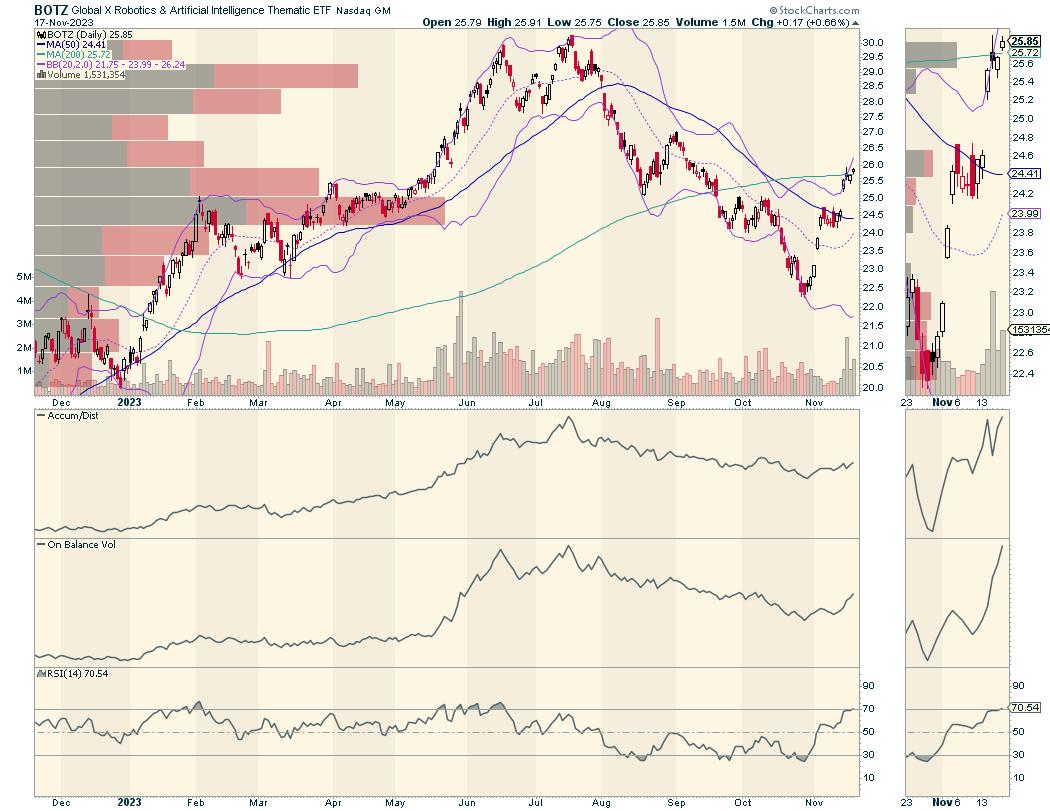
A great way to invest in AI is via the Global X Robotics ETF (BOTZ), which topped out in August and crashed and burnt decisively until late October. Since then, it has mounted an increasingly credible rebound, which is now testing its 200-day moving average.
Accumulation/Distribution (ADI) and On Balance Volume (OVB) are in sync, which is usually a bullish development, as it means short-covering (ADI) and actual buying (OBV) are occurring simultaneously. A move back to the $28-$29 area is quite possible over the next few weeks as the year-end rally unfolds.
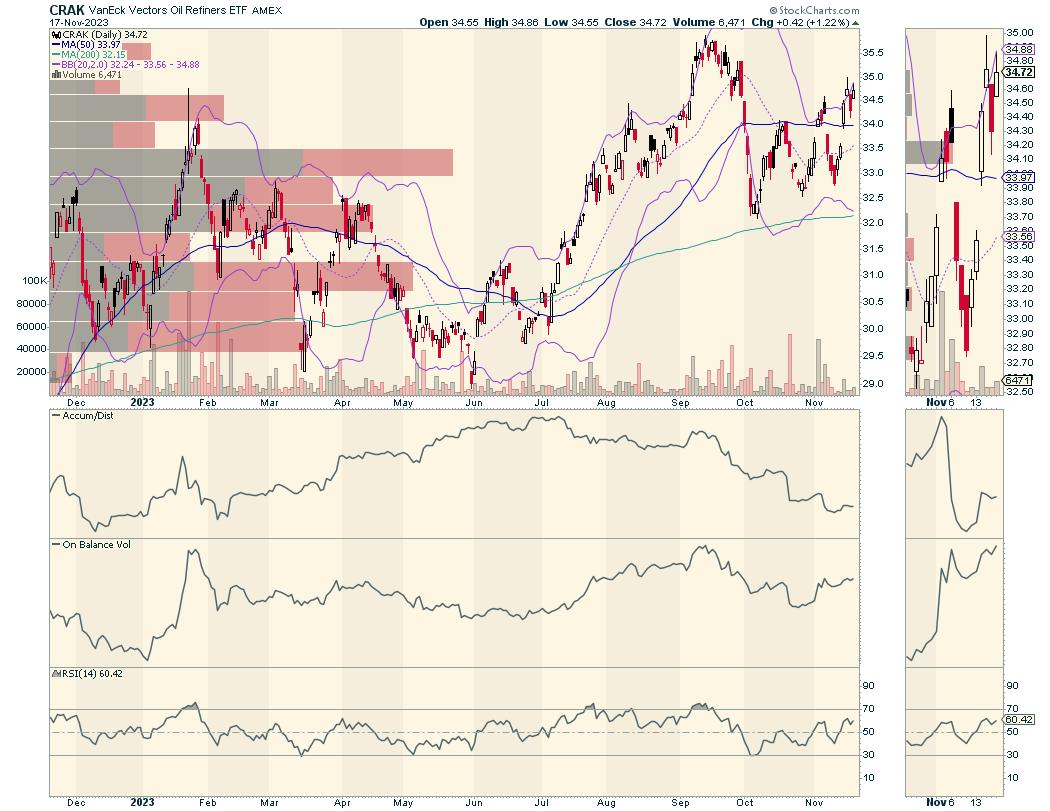
Another under-the-radar winning sector of late has been that of oil refiners. This is certainly counter-intuitive, as gasoline prices have fallen significantly due to lower demand and relatively high production. But the price chart disagrees with the doom and gloom in the news and money has been flowing into this area of the market.
Moreover, the sector has rallied despite a decline in ADI, which means short sellers are still betting against it. On the other hand, OBV is in much better shape, which suggests value players are adding to positions in this ETF on dips.
At some point, one of the two groups will gain supremacy and the ETF will make a big move. Right now, the price action is on the side of the bulls. There is great support at $32-$34. If this ETF breaks out above $36, it could move decidedly higher.
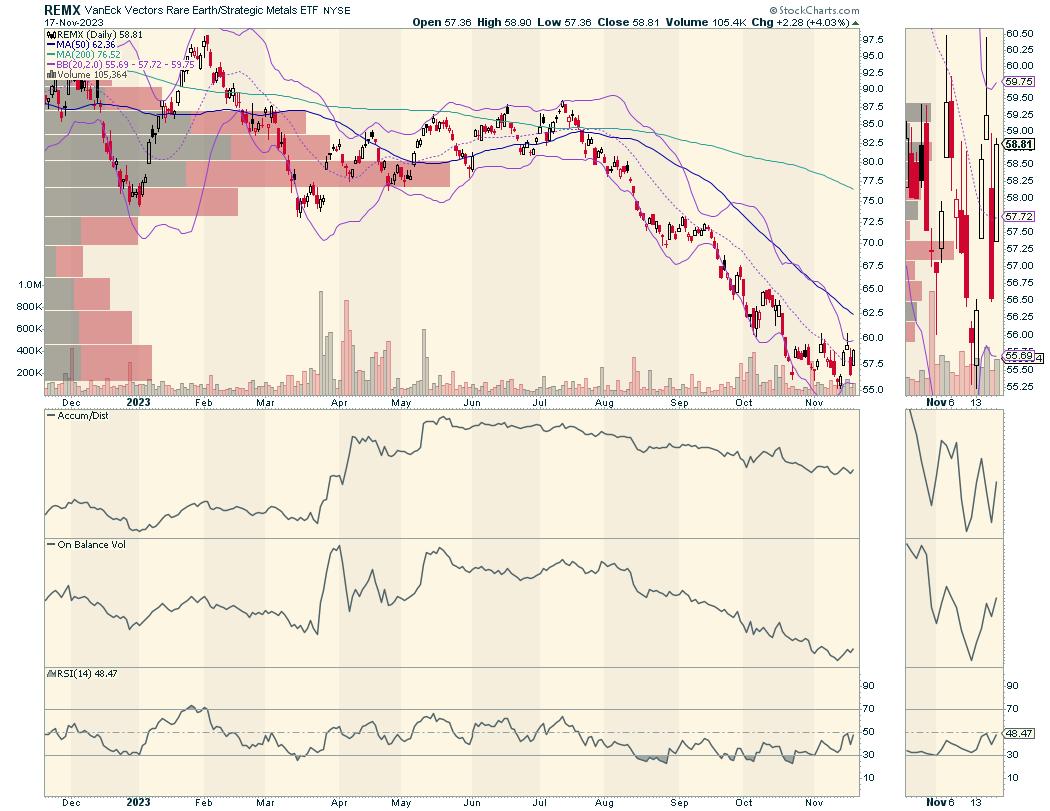
Finally, I'm keeping an eye on the Van/Eck Vectors Rare Earth/Strategic Metals ETF (REMX). Specifically, I'm monitoring what happens over the next few weeks, given that a bottom seems to be forming above $55. Both ADI and OBV look awful, so I'm not keen to own this one, at least not yet.
But as tensions between China, the world's leading rare earth minerals producer, and the U.S. persist, these natural resources are likely to move to the forefront of the Wall Street talk machine, which means that this ETF is one to keep tabs on.
Aside from recommending multiple big winners in the homebuilder sector, I recently recommended a technology ETF which is now breaking out in a big way. Join the smart money at Joe Duarte in the Money Options.com where you can have access to this ETF and a wide variety of bullish stock picks FREE with a two week trial subscription.
Market Breadth Improves; Big Test Lies Ahead
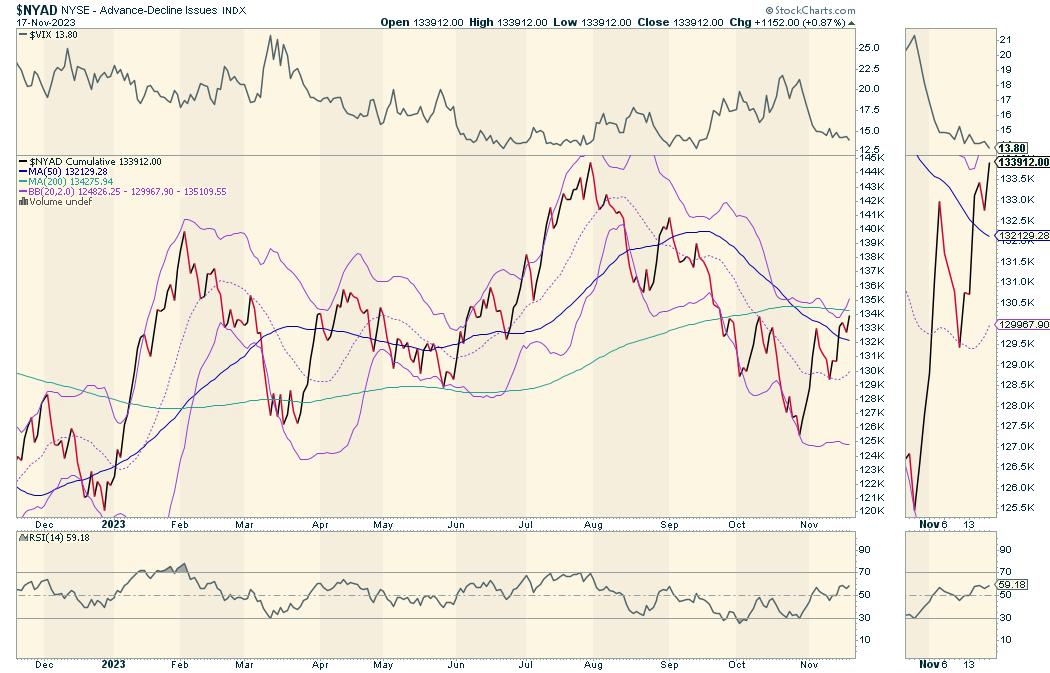
The NYSE Advance Decline line (NYAD) has bottomed out and crossed above its 50-day moving average, but has not its yet reached the 200-day line. So, while there is improvement, we don't have a definitively bullish long-term signal for the market's trend, at least not yet. On the other hand, if the current trend stays in place, a move above the 200-day is on its way; which means that the odds of the rally accelerating are slowly rising. Most encouraging is the RSI indicator, which is nowhere near overbought, suggesting the rally still has room to move higher.
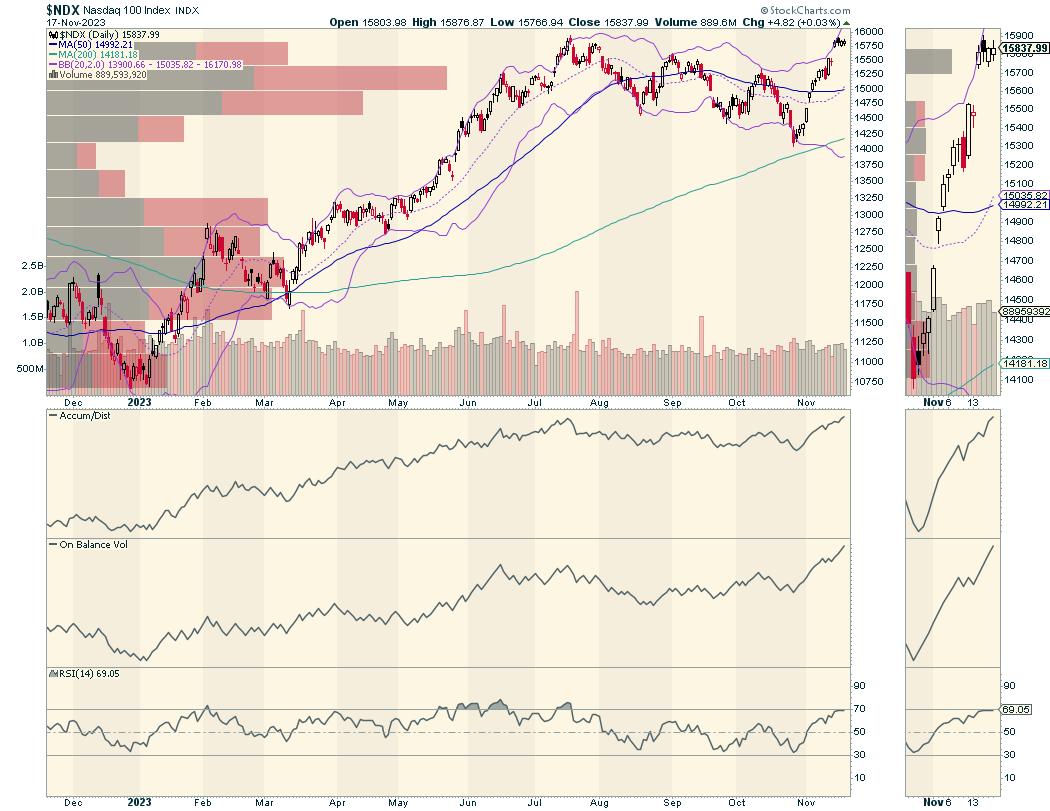
For its part, the Nasdaq 100 Index (NDX) is nearing a breakout above 16,000 after rallying nicely above its 50-day moving average. Both ADI and OBV are now rising as short sellers cover (ADI) and buyers move in (OBV). A move above 15,800-16,000 would likely extend the rally further.
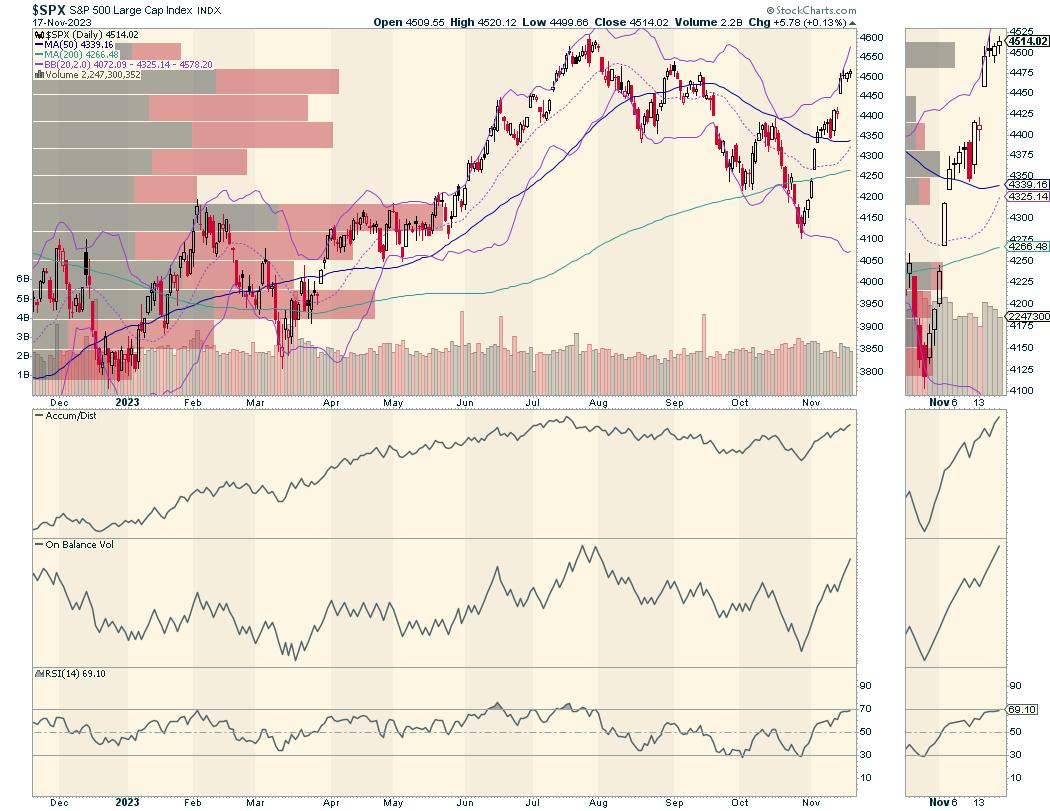
The S&P 500 (SPX) is well entrenched in a bullish trend, as it's now moved well above 4500. SPX is well above its 200-day moving average, returning to bullish territory after its recent dip below 4150. Moreover, it has now survived a test of the 4350 support area.
VIX is Back Below 20
The CBOE Volatility Index (VIX) continues to fall, closing below 15 last week. This is bullish.
A rising VIX means traders are buying large volumes of put options. Rising put option volume from leads market makers to sell stock index futures, hedging their risk. A fall in VIX is bullish, as it means less put option buying, and it eventually leads to call buying. This causes market makers to hedge by buying stock index futures, raising the odds of higher stock prices.
To get the latest information on options trading, check out Options Trading for Dummies, now in its 4th Edition—Get Your Copy Now! Now also available in Audible audiobook format!
 #1 New Release on Options Trading!
Good news! I've made my NYAD-Complexity - Chaos chart (featured on my YD5 videos) and a few other favorites public. You can find them here.
Joe Duarte
In The Money Options
Joe Duarte is a former money manager, an active trader, and a widely recognized independent stock market analyst since 1987. He is author of eight investment books, including the best-selling Trading Options for Dummies, rated a TOP Options Book for 2018 by Benzinga.com and now in its third edition, plus The Everything Investing in Your 20s and 30s Book and six other trading books.
The Everything Investing in Your 20s and 30s Book is available at Amazon and Barnes and Noble. It has also been recommended as a Washington Post Color of Money Book of the Month.
To receive Joe's exclusive stock, option and ETF recommendations, in your mailbox every week visit https://joeduarteinthemoneyoptions.com/secure/order_email.asp.
